THERMO-ELECTRIC DESIGN OF A 400 kA CELL
USING MATHEMATICAL MODELS: A TUTORIAL

Marc Dupuis
GéniSim
3111 Alger St.
Jonquière, Québec, Canada G7S 2M9
http://www.genisim.qc.ca
e-mail:

Abstract

This paper presents a typical application of thermo-electric mathematical models to produce a thermally balanced aluminum reduction cell lining design. The paper is structured as a tutorial, the selected example is a modern prebaked PBF cell running at 400 kA.

The models used are the now standard steady state thermo-electric 3D full cell slice model and the lump parameters dynamic process model as well as the newly developed dynamic thermo-electric 2D+ full cell slice process model.

Introduction

In the past twenty years, the aluminum reduction cell technology has evolved from a 180-225 kA cell standard to a 295-320 kA standard for new greenfield smelter projects. Since that current standard is now ten years old, one might argue that some physical limits have been reached and are preventing further increase of cell amperage.

This paper illustrates how straightforward it is, when using the proper tools, to design a thermally balanced cell running at 400 kA starting from an existing 300 kA cell. This clearly indicates that the cell thermal balance consideration is not in any way preventing further increase of the cell amperage.

Step-by-step retrofit study

In order to illustrate the process of performing a thermo-electric retrofit study having as objective to increase the amperage of an existing 300 kA cell, yet using public domain informations, the base case cell design presented here is inspired from the one published in a JOM February 1994 article[1]. The aim of the study is to design a thermally balanced cell running at 400 kA.

Step 1: Development and validation of the base models

The initial step of a retrofit study is to characterize the operation of the existing cell. This is performed by carrying a number of thermal blitz campaigns[2,3] in order to well establish the typical thermo-electric behavior of the existing technology.

Based on that information and also on the material properties characterization obtained from post mortem studies, the base case thermo-electric model can be developed and more importantly validated. Proper base case model validation is critical to insure the accuracy of the predicted retrofitted cell performance.

The retrofit study presented here relies on the use of three numerical tools: the 3D full cell slice model, the 2D+ full cell slice model[4,5] and the lump parameters dynamic model[2,6].

The key characteristics of the base case cell are:

Amperage

300 kA

Nb. of anodes

32

Anode size

1.6 m X 0.8 m

Nb. of anode studs

3 per anode

Anode stud diameter

18 cm

Anode cover thickness

16 cm

Nb. of cathode blocks

18

Cathode block length

3.47 m

Type of cathode block

30 % graphitic

Type of side block

30 % graphitic

Side block thickness

15 cm +

ASD and AED

35 cm

Inside potshell size

14.4 m X 4.35 m

ACD

5 cm

Excess AlF3

10.9 %

Operating temperature

973.3 ° C

Liquidus superheat

6.8 ° C

Current efficiency

94.0 %

Internal heat

628 kW

Energy consumption

13.75 kWh/kg


Step 2: Reduce the ACD to 4 cm

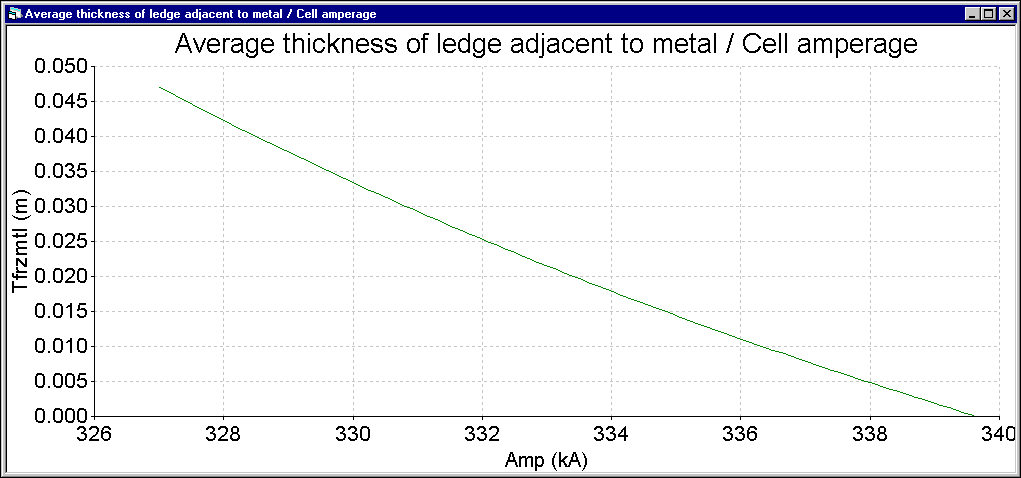
The impact of reducing the ACD can be easily studied by using the Trend option available in DynaMarc, the lump parameters model. As it can be seen in Figure 1, it is possible to maintain the same thermal balance by exchanging ACD for extra amperage.

Figure 1

In this step, the following cell characteristics have changed:

Amperage

320 kA

ACD

4 cm

Step 3: Increase the anode length by 10 cm

Again, by using the lump parameters model, it is possible to study the impact of increasing the anode length, keeping the assumption that the heat balance must remain unchanged (see Figure 2).

Figure 2

In this step, the following cell characteristics have changed:

Amperage

327 kA

Anode length

1.7 m

ASD

25 cm

Step 4: Change of bath chemistry

The aim of this step is to improve the cell current efficiency by decreasing the cell temperature. Unfortunately, by doing so, the bath resistivity increases at the same time. This rise of the bath resistivity more than neutralizes the

beneficial impact of increasing the current efficiency on the heat dissipation. So, unfortunately, the internal heat augments in this step:

Excess AlF3

13.5 %

Operating temperature

961.1 ° C

Liquidus superheat

7.4 ° C

Current efficiency

95.8 %

Internal heat

641 kW

Energy consumption

13.15 kWh/kg

Step 5: Confirming changes in 2D+ model

So far, only the very fast lump parameters model has been used to carry on steps 2 to 4. Since the next steps of amperage increase will involve changes in the cell lining design, the 2D+ model will now be needed.

In step 5, the 2D+ model was used to confirm the predictions of the lump parameters model. The more accurate 2D+ model confirms the bulk predictions with the following slight changes:

Operating temperature

960.8 ° C

Liquidus superheat

7.1 ° C

Internal heat

639 kW

Energy consumption

13.09 kWh/kg

The 2D+ model also predicts that the ledge thickness will decrease from 2.87 cm to 2.48 cm on average at metal level and from 7.25 cm to 6.81 cm on average at bath level, jumping from step 1 to step 5.

Step 6: Modifying cathode and side wall blocks

The next obvious move, is to replace the 30% graphitic cathode blocks by 100% graphitized blocks and the 30% graphitic side blocks by silicon carbide side blocks. At the same time, the cathode block length is increased by 20 cm to 3.67 m in order to regain the 6 cm block extension over the anode shadow considering the 10 cm anode length extension performed in step 3.

The maximum side wall thickness is also reduced to 10 cm in order to regain at least a 30 cm ASD. The new cell characteristics after this step are:

Cathode block length

3.67 m

Type of cathode block

100 % graphitized

Type of side block

Silicon carbide

Side block thickness

10 cm +

ASD

30 cm

Operating temperature

958.9 ° C

Liquidus superheat

5.2 ° C

Current efficiency

96.0 %

Internal heat

624 kW

Energy consumption

12.95 kWh/kg


Step 7: Decreasing the anode cover thickness

The very impressive results obtained in step 6 clearly indicate that there is a potential for further amperage increase. This is confirmed by the Trend analysis performed in DynaMarc (see Figure 3).

Figure 3

Following this analysis, it seems safe to increase the cell amperage to 335 kA. Yet, in order to maintain comfortable ledge thickness, it is decided to decrease the anode cover from 16 cm to 10 cm.

According to the 2D+ model results, the new cell characteristics after this step will be:

Amperage

335 kA

Anode cover thickness

10 cm

Operating temperature

959.2 ° C

Liquidus superheat

5.5 ° C

Internal heat

657 kW

Energy consumption

13.2 kWh/kg

Step 8: Increasing stud diameter to 19 cm

Results of step 7 still indicate a potential for cell amperage increase. Yet, in order to be able to dissipate still more heat through the anode panel, it is decided to increase the anode stud diameter to 19 cm. At the same time, the cell amperage is increased to 345 kA. The 2D+ model results after this step are:

Amperage

345 kA

Anode stud diameter

19 cm

Operating temperature

960.3 ° C

Liquidus superheat

6.6 ° C

Internal heat

695 kW

Energy consumption

13.35 kWh/kg

Step 9: Increasing cell amperage to 350 kA

Since step 7, the anode current density has been increased from 0.751 A/cm2 at 327 kA to 0.793 A/cm2 at 345 kA. The energy consumption figure suffers a bit from this current density increase going up from 12.95 kWh/kg to 13.35 kWh/kg.

Despite the design changes aiming to increase the anode panel heat dissipation characteristics, the cell superheat increases nevertheless from 5.2 °C to 6.6 °C. Consequence of the superheat increase, the ledge thickness at metal level decreases from 5.94 cm to 4.17 cm on average.

At this point, it was decided to try to see if the amperage could be pushed to 350 kA. Considering that the 2D+ model is not recommended to study the impact of a stud diameter increase, it was considered safe to consolidate the model predictions by using the 3D model. So, at this step, the consolidated 3D model results are:

Amperage

350 kA

Operating temperature

960.4 ° C

Liquidus superheat

6.7 ° C

Current efficiency

96.1 %

Internal heat

713 kW

Energy consumption

13.4 kWh/kg

Average ledge thickness at metal level

4.4 cm

It can be noticed that the 3D model results indicate that the 2D+ model underestimated the beneficial impact of the stud diameter increase.

This concludes the retrofit study as it was considered that at 0.804 A/cm2 and 13.4 kWh/kg, the maximum recommended cell amperage has been reached. So, at 350 kA, half the way to the 400 kA objective set up at the beginning of the study has been covered.

Greenfield study

The above retrofit study simply confirms a bigger cell is really needed in order to be able to operate at 400 kA!

This represents no particular difficulty since it is very fast and strait forward to study the impact of increasing the cell size using the lump parameters model.


Step 1: Establishing ball park figures for the new required cell size using the lump parameters model.

It is straightforward to estimate that four extra anodes are needed to increase the cell amperage by 50 kA while maintaining the anode current density more or less constant. By assuming that the anode panel heat dissipation will increase proportionally to the anode surface and that the cell length will need to be increased by around 1.7 m, the following figures from the lump parameters model are obtained in no time:

Amperage

400 kA

Nb. of anodes

36

Anode size

1.7 m X 0.8 m

Nb. of anode studs

3 per anode

Anode stud diameter

19 cm

Anode cover thickness

10 cm

Nb. of cathode blocks

20

Cathode block length

3.67 m

Type of cathode block

100 % graphitized

Type of side block

Silicon carbide

Side block thickness

10 cm +

ASD and AED

30 cm

Inside potshell size

16.1 m X 4.35 m

ACD

4 cm

Excess AlF3

13.5 %

Operating temperature

962.2 ° C

Liquidus superheat

8.5 ° C

Current efficiency

96.0 %

Internal heat

821 kW

Energy consumption

13.5 kWh/kg

Average ledge thickness at metal level

0.2 cm

Because adding four anodes is not exactly enough, the anode current density has increased to 0.817 A/cm2. This explains why the side ledge melted away, leaving almost none at the metal level according to the lump parameters model. Of course, this prediction needs to be confirmed by more accurate models.

Step 2: Results consolidation using the 2D+ model

The 2D+ model requires a bit more information than the lump parameters model. As an example, the lump parameters model does not care about the cathode blocks geometry, while the 2D+ model does.

So, it is at this stage that it was established that two extra cathode blocks were required and that the 20 blocks of the 400 kA cell needed to be wider than the 18 blocks of the 300 kA cell.

As expected, the 2D+ model results are slightly different from the rough lump parameters model ones:

Operating temperature

962.4 ° C

Liquidus superheat

8.7 ° C

Current efficiency

96.0 %

Internal heat

834 kW

Energy consumption

13.6 kWh/kg

Average ledge thickness at metal level

2.2 cm

The increase of the cell internal heat comes from the impact of the higher voltage drop in the anodes and cathodes blocks resulting from the higher current density. The next stage of confirmation is to use the 3D model to consolidate the 2D+ model predictions.

Step 3: Results consolidation using the 3D model

No major discrepancies are expected at this step since the 2D+ model has been recalibrated to more accurately reproduce the 3D model's anode drop predictions for a 19 cm stud diameter:

Operating temperature

961.7 ° C

Liquidus superheat

8.0 ° C

Current efficiency

96.1 %

Internal heat

831 kW

Energy consumption

13.6 kWh/kg

Average ledge thickness at metal level

3.4 cm

Step 4: Monte Carlo risk assessment study

Although the 3D cell slice model is the most accurate model used in this study, one cannot expect its predictions to be 100% correct. To get even more accurate predictions, it is possible to develop even bigger models like the full 3D cell quarter model (see Figure 4).

Yet, even with a model 100% accurate as far as geometry reproduction is concerned, model inaccuracies related to used materials properties measurements or thermal blitz measurements will ever prevent models predictions to be 100% accurate.


Figure 4

Considering that fact, it is important to try to assess the interval of confidence of the model predictions assuming a given model accuracy. This can be performed by using the lump parameters model to carry a Monte Carlo risk assessment study[2,7].

By assuming that key 3D model results like anode panel heat loss, cathode bottom heat loss, anode voltage drop and cathode voltage drop may be independently up to 5 % too optimistic, the Monte Carlo study shows up that the predicted average ledge thickness at metal level may be up to 8 mm or 23% too optimistic (lump parameters model calibrated on 2D+ model results).

That study also predicts that the mean probability is that the ledge thickness is 3 mm or 9% too optimistic (see Figures 5).

Figure 5

Obviously, such Monte Carlo studies will always remain highly speculative since the impact of ¨assumed¨ model inaccuracy is being assessed! Yet, carrying up such studies can be very useful to either justify to carry on more model validation studies or to incorporate bigger safety factors in the proposed design.

Step 5: New design ease of operation dynamic study

Another important type of study that can be carried out to help assess the value of the new proposed design is an ease of operation assessment study using the dynamic mode of the lump parameters model.

Such a dynamic study can be used to evaluate the impact of anode changing, metal tapping, etc on the cell pseudo-resistance and superheat evolution (see Figures 6 and 7)

Figure 6

Figure 7

More importantly, such a study can help assess how much the ledge thickness will fluctuate reacting to those normal process perturbations in order to be able to evaluate if the predicted average thickness provides enough buffer protection.


As it can be seen in Figures 8 and 9, the metal ledge thickness distribution is characterized by the 2.4 mm standard deviation in the best possible process operation conditions.

Figure 8

Figure 9

Considering the results obtained in steps 4 and 5, a judgement call must be made on the level of risk involved in building and trying to successfully operate the proposed cell design in a prototype.

For sure, even with the best models available, one should never expect to get the perfect cell design out of the very first prototype!

Conclusions

In only a few straightforward steps, the 300 kA base case cell was retrofitted into a 350 kA cell and then into a new 16 m long greenfield 400 kA cell.

This should clearly indicate that designing a properly balanced cell lining design even at 400 kA does not pose a serious technological challenge when proper numerical tools are used by an experienced cell designer.

References

  1. V.A. Kryukovski, G.A. Sirasutdinov, J. Klein and G. Peychal-Heiling, ¨Internanional Cooperation and High-Performance Reduction in Siberia¨, JOM, 46(2) (1994), 23-25.

  2. M. Dupuis, ¨Process Simulation¨, TMS Course on Industrial Aluminum Electrolysis, (1997).

  3. M. Dupuis and C. Fradet, ¨Using ANSYSŪ Based Aluminum Reduction Cell Energy Balance Models to Assist Efforts to Increase Lauralco's Smelter productivity¨, Proceeding of the ANSYSŪ 8th International Conference, volume 2, 2.233-2.240, (1998).

  4. M. Dupuis, ¨Computation of Aluminum reduction Cell Energy Balance Using ANSYSŪ Finite Element Models¨, Light Metals, (1998).

  5. M. Dupuis and R. Lacroix, ¨Development of a 2D+ Dynamic Model of an Aluminum Reduction Cell¨, Proceeding of the 38th Conference on Light Metal, CIM, (1999), 41-55.

  6. I. Tabsh, M. Dupuis and A. Gomes, ¨Process Simulation of Aluminum Reduction Cells¨, Light Metals, (1996), 451-457.

  7. M. Dupuis and I. Tabsh, ¨Using a Steady-State Model of an Aluminum Reduction Cell to Investigate the Impact of Design Changes¨, Proceeding of the 35th Conference on Light Metal, CIM, (1996), 419-429.