power spectra of the non-linear cell stability analysis results are presented in Figure 21.
In order to save some CPU time, the non-linear stability analysis was carried out
reason, it is not so easy to compare the results obtained. Nevertheless, it seems that by
increasing the ledge thickness from 4 cm to 10 cm, the cell is predicted to be a bit more
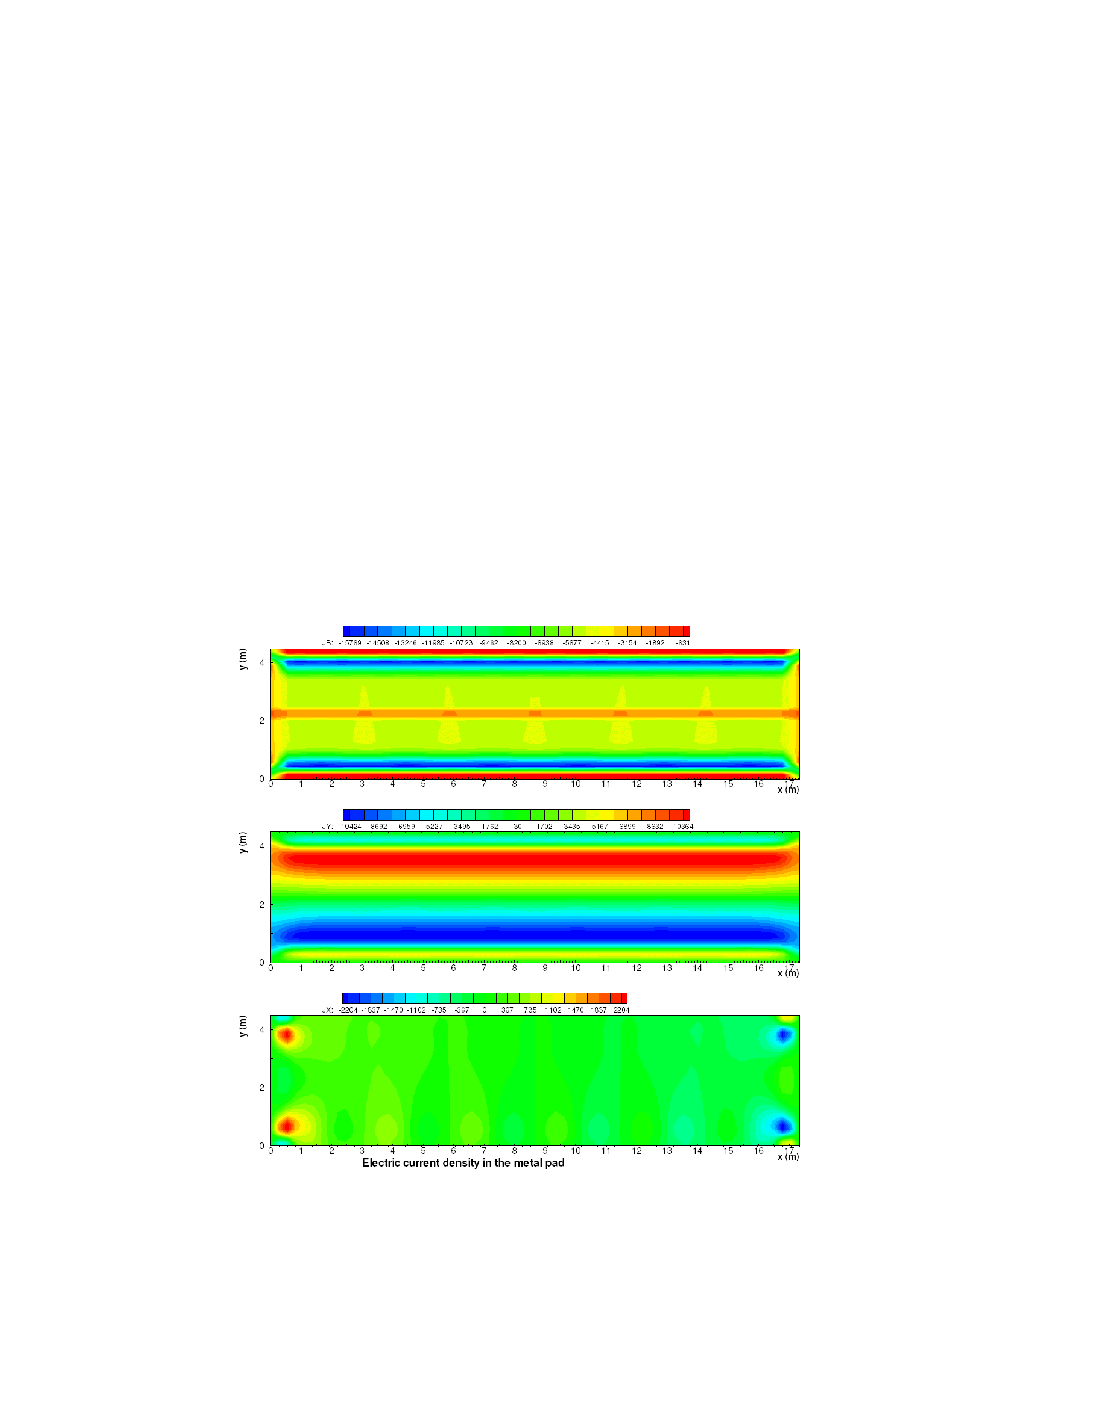
stable which is consistent with the slight decrease of the intensity of the horizontal
current in the metal pad. It is interesting to notice that in modern cell design, such a
reduction of horizontal current intensity and cell stability improvement is achieved by not
rodding the collector bar up to the edge of the cathode block.
Yet, as we can see in Figures 22 and 23, this tendency is reversing fast as the case
thickness.