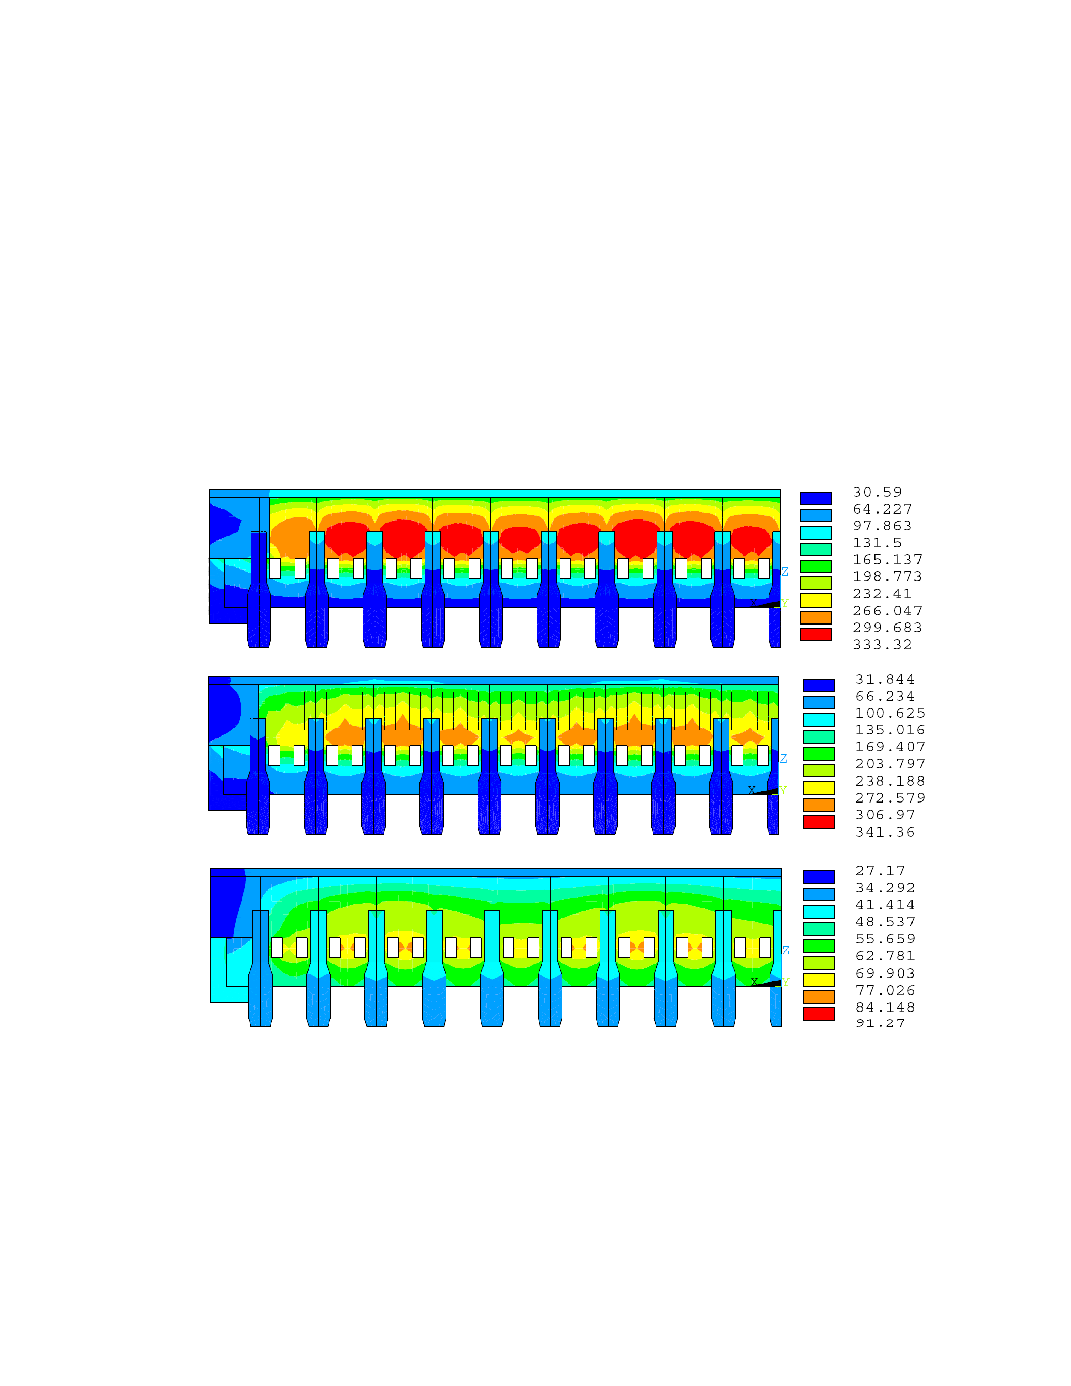
The obtained temperature distributions are shown in Figure 5a) for the 300 kA
cooling. The fin configuration used in Figure 5b) reduces the temperature gradient in the
shell upper sidewall, but slightly increases it just above the collector bars. This surprising
side effect will have an impact on the mechanical displacement as will be seen later. The
forced-air cooling in Figure 5c) is so effective that the maximum shell temperature is
now on the floor.
The vertical displacement on the long axis of the shell floor is compared for all