M. Dupuis GéniSim Inc. 3111 Alger St. Jonquière, Québec, Canada G7S 2M9 V. Bojarevics University of Greenwich, School of Computing and Mathematics 30 Park Row London, SE10 9LS, UK V.Bojarevics@gre.ac.uk
J. Freibergs
University of Latvia, Institute of Physics
32 Miera St.
Salaspils, 2169, Latvia
JF@sal.lv
ABSTRACT
In the present study, a 3D full cell quarter thermo-electric model of a 500 kA demonstration cell has been developed and solved.
In parallel, a non-linear wave MHD model of the same 500 kA demonstration cell has been developed and solved.
A preliminary study of the impact of the interactions between the cell thermo-electric and MHD models will be presented.
INTRODUCTION
Nowadays, it is well established that no Hall-Héroult aluminium electrolysis cell retrofit or greenfield study can be carried on without the support of mathematical models. It is also well known that it has been quite difficult to develop reliable models of the Hall-Héroult cell because of the complex nature of the process. This is particularly true for the two principal types of models required, namely the thermo-electric cell heat balance model and the magneto-hydro-dynamic (MHD) cell stability model.
When looking back in the literature in the field of Hall-Héroult cell model development, failures are quite more visible than successes. For example, in his 1990 JOM article [1], Julian Szekely described the Hall-Héroult process as "too complex to be modeled exactly". It is clear that in the 70's and 80's the huge investment of R&D money put in the development of complex Hall-Héroult models did not deliver the expected payback.
Yet, it is also clear that most of the major producers have managed to develop reliable models that they are successfully using to produce new cell designs. Unfortunately, most of those model development and application success stories are not too widely publicized as companies want to keep confidential anything that is contributing to their competitive edge.
Fortunately for the rest of the aluminium producers, there are also a few reliable models that are available from consultants in the open market. The authors of the present work have independently developed both a reliable thermo-electric modeling technology [2] and a reliable MHD modeling technology [3]. They are now starting to join their efforts in order to interconnect their respective models as a first step toward integrating them into a fully coupled thermo-electro-MHD model [4,5].
500 kA CELL DEMONSTRATION TEST CASE
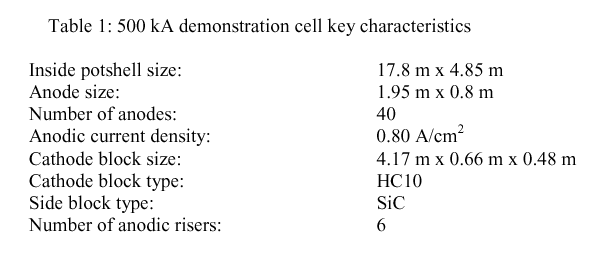
In order to both demonstrate at the same time the value of their current modeling technology and perform their new model interconnection development on a challenging test case, the authors have selected the 500 kA cell design presented in [6]. The key characteristics of that design are:

3D FULL CELL SIDE SLICE THERMO-ELECTRIC MODEL
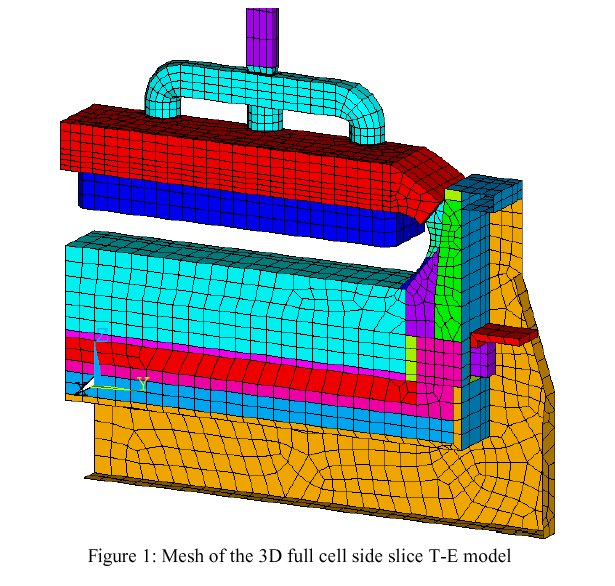
Figure 1 shows the mesh of the 3D full cell side slice thermo-electric model that can be used to accurately compute the cell heat balance. In that model, a 3 studs (20.5 cm in diameter) anode design is used while it was recommended to use a 4 studs (17.5 cm in diameter) design in the preliminary study [6]. The 4 studs design has not been modeled so far, because this type of anode model topology was not readily available.
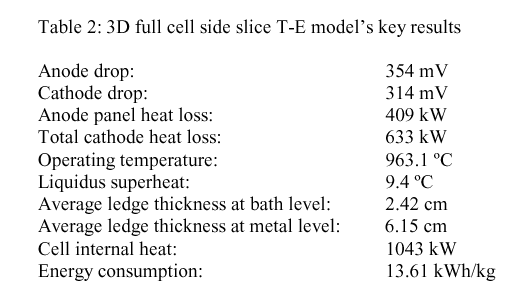
When compared to the results of the 4 studs (17.5 cm of diameter) anode design of the preliminary study [6], we can see that there is a penalty of around 35 mV for using a 3 studs (20.5 cm of diameter) anode design instead. In the context of a real 500 kA cell thermal design study, building the topology of a 4 studs design anode model would certainly be a very high priority!
3D FULL CELL QUARTER THERMO-ELECTRIC MODEL
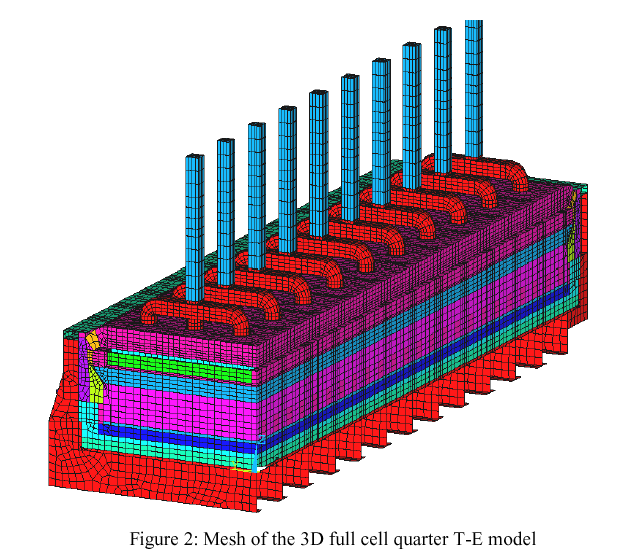
In the context of the present study, the next priority was rather the extension of the 3D full cell side slice model into a full cell quarter including the liquid zone thermo-electric model (see figure 2).
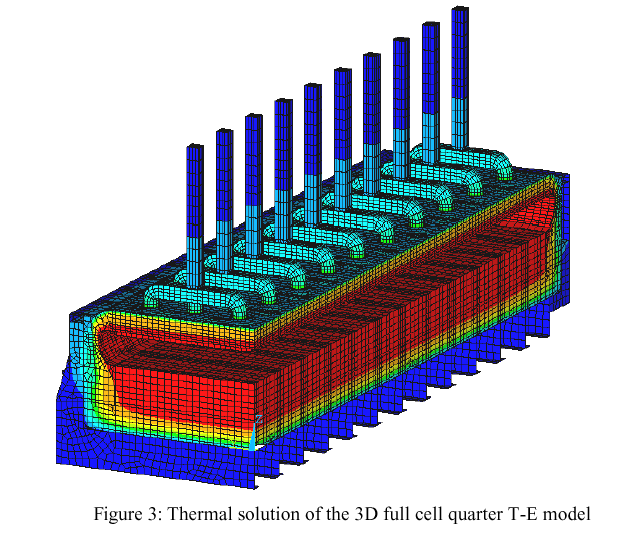
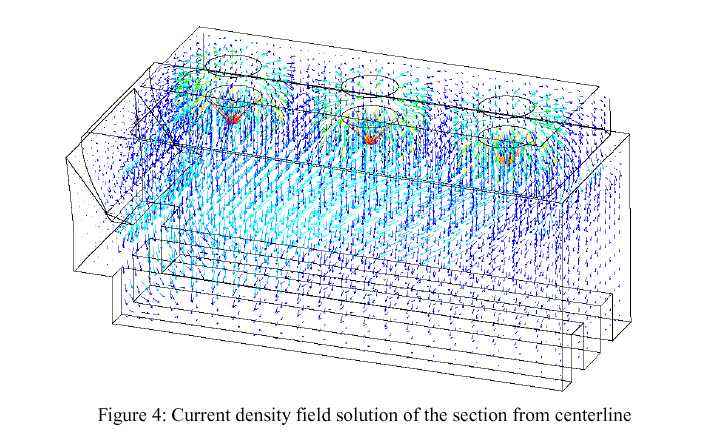
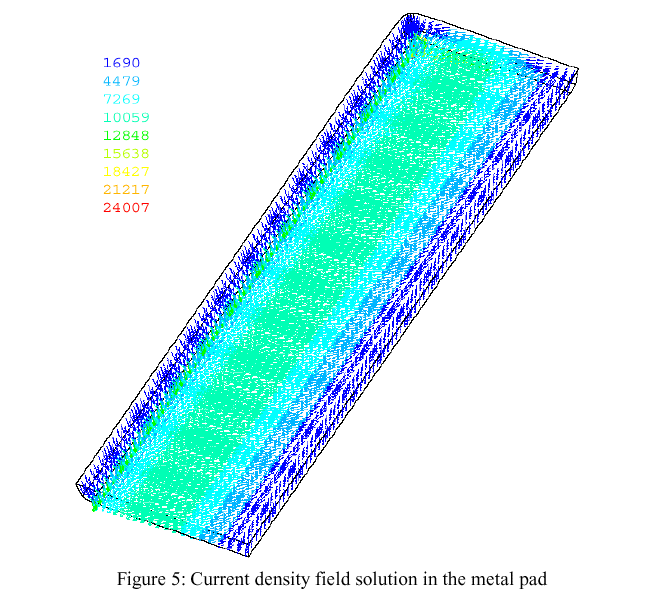
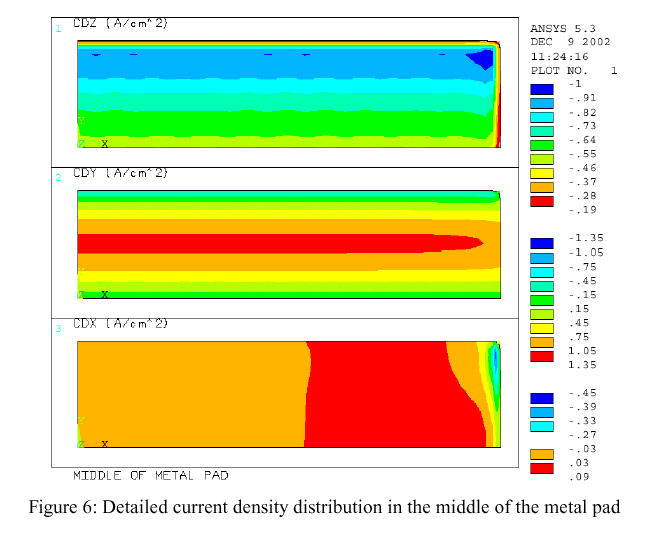
Of course, this type of model is quite useful to get the detail end wall heat loss and ledge profile and refine the end wall lining design accordingly (see figure 3). But, more importantly, as already described in previous papers [7,4], this type of model can be used to assess the impact of the ledge profile on the current density field in the liquid zone (see figure 4, 5 and 6).
Already at this point, we can assess the impact of the thermo-electric lining design on the cell MHD behavior. For example, the cell corner lining design will dictate the cell corner ledge profile that in turn will have a big impact on the metal pad corner current density field, which in turn could have a critical impact on the MHD cell stability.
The next phase of 3D thermo-electric model development would be the full cell half with busbar model [4]. On its own, the busbar design already involves both the MHD and thermo-electrical models as the busbar layout is dictated by MHD cell stability model results, yet the busbar sizing is done using a thermo-electric model. By adding the busbar thermo-electric model to a full cell half thermo-electric model we can analyze the impact of an imperfectly balanced busbar on the metal pad current density (assuming that the busbar is symmetric).
MHD MODEL
The electric current in an aluminium electrolysis cell drives the essential electrochemical reactions and produces Joule heating for maintaining the delicate thermal balance; however it generates also a volume force distribution within the liquid aluminium and the electrolyte. The force distribution is rather non-uniform and therefore drives fluid flow and can easily produce waves at the interface between the liquid layers. The control of the magnetic field, created by the currents in the cell, in the complex bus-bar arrangement around the cell, in the neighbor cells and the return line, and by the effect of cell steel parts magnetization, is of prime importance for maintaining a desirable gentle mixing in the fluid volumes and to avoid unstable wave growth with the intense flow associated wall erosion. The complexity of any practically usable magneto-hydro-dynamic (MHD) model for the cell arises from the complete coupling of the various physical effects: fluid dynamics, electric current distribution (depending on the electrochemical reactions rate), magnetic field and thermal field. The MHD model presented here accounts for the first three couplings, leaving the full thermal coupling as the task for the nearest future.
This model is a generalization of the previous non-linear wave model [8] by accounting for the turbulent flows in the two fluid layers. The electromagnetic simulation is extended to include individual anode and cathode collector connections not only to the fluid layers, but also to the whole bus bar circuit where the electric connections between the bus bars are simulated for all the network of bars between two adjacent cells. All the necessary Kirchhoff equations are generated automatically and solved at each time step in order to simulate the wave effect on the electrical current redistribution in the whole electrical circuit including the liquid metal and bath with locally varying ACD, ledge effect, etc. The electrical network can be periodically continued to include more neighboring cells in the magnetic field computation. The ferromagnetic construction parts effect is included as well [9].
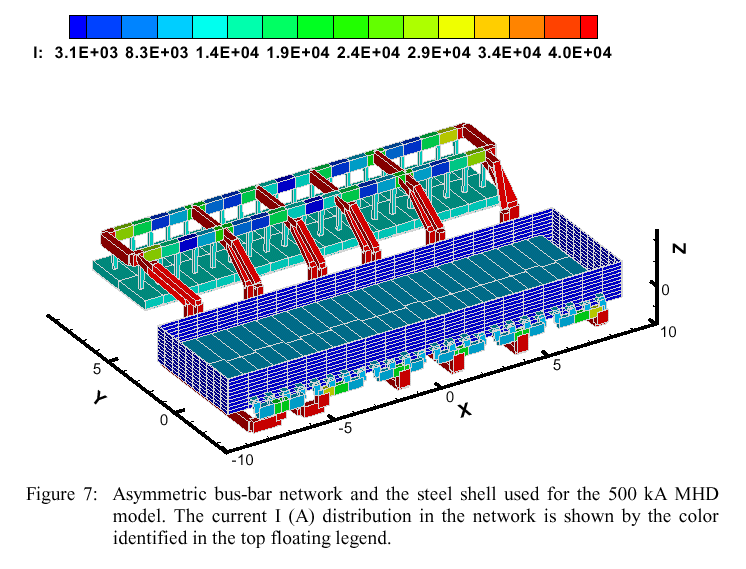
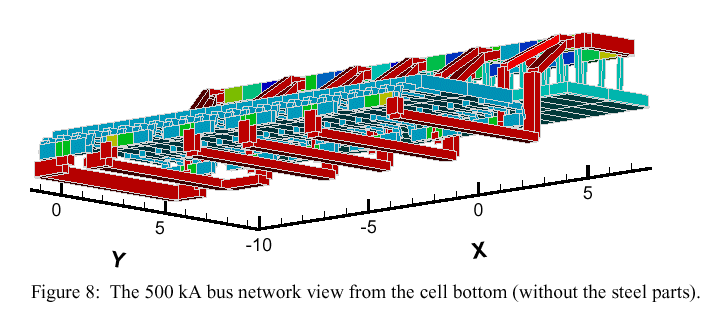
After the input of the cell data and the bus network in a specially designed compact 'table file', the bus network can be visualized in a 3-d view using the widely used commercial package Tecplot. Adding connections, changing bus locations and cross-sections is quite easy, giving the freedom to experiment and optimize the network. The bus arrangement for the presently investigated 500 kA cell and the steel shell are shown in Figure 7. The on-screen view can be arbitrary rotated, shifted and zoomed-in to inspect the details, as in Figure 8 showing a bottom view for the cell. The currents, their time dependent deviations from a stationary state and the temperature of the bars can be shown in color at different time moments.
The asymmetric bus arrangement for this cell partly compensates the return line on the left at x = -60 m. All the electrically independent cathode collectors are connected in 12 sections taking current from 4 collector bars each, and then the upstream and downstream counterparts are connected at 6 risers to the anode ring. There is almost 50 - 50 per cent upstream and downstream current division owing to the adjusted cross-sections for the individual sections.
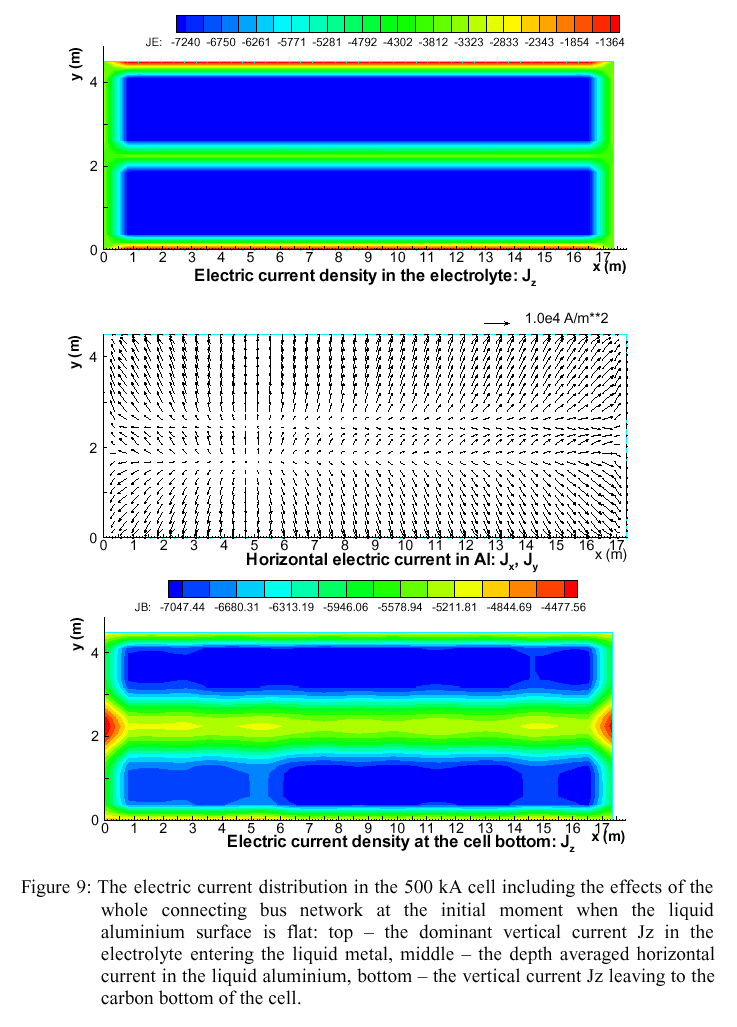
The electric current distribution in the fluid layers is shown in Figure 9, as computed for the initial flat interface between the metal and electrolyte. The cathode collector currents are not exactly equal because of the bus connections, unequal lengths and cross-sections for the respective connecting bus elements. The horizontal current in the case of the flat aluminium surface arises because of the anode and collector bar geometrical differences and the tendency for the cathode current to find the path of the least resistivity (with the effect of ledge).
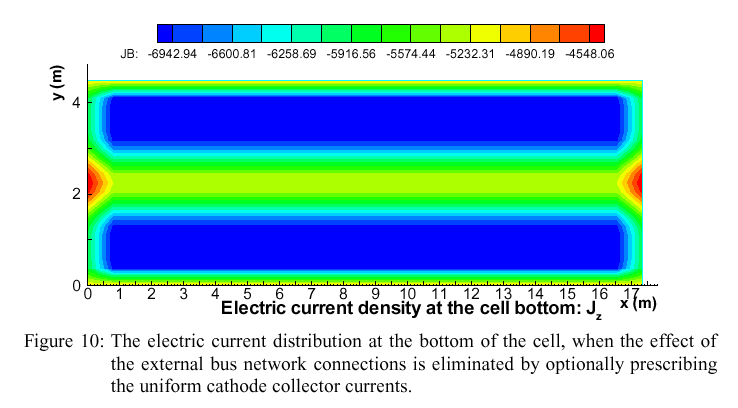
There is an option in the model for the individual collector bar currents to be imposed, for instance taken from measurements for a particular cell in pot-line (for diagnostic purposes). Figure 10 demonstrates the case where equal currents, equal to 500 kA/48, are imposed for each collector. This type of solution corresponds to the thermo-electric model solution without the effect of the bus bar network connections as shown in the Figure 6, which gives more detailed current distribution with finer mesh representations.
The MHD model uses less fine mesh in order to re-compute the current distribution at each time step with the fluid dynamic evolution. Resulting from the aluminium-electrolyte interface deformation the anodic currents are becoming unequal, following the local ACD change. In addition, the model includes an option to account for the time average gradual burn-out of the anode bottom to accommodate to the ACD change.
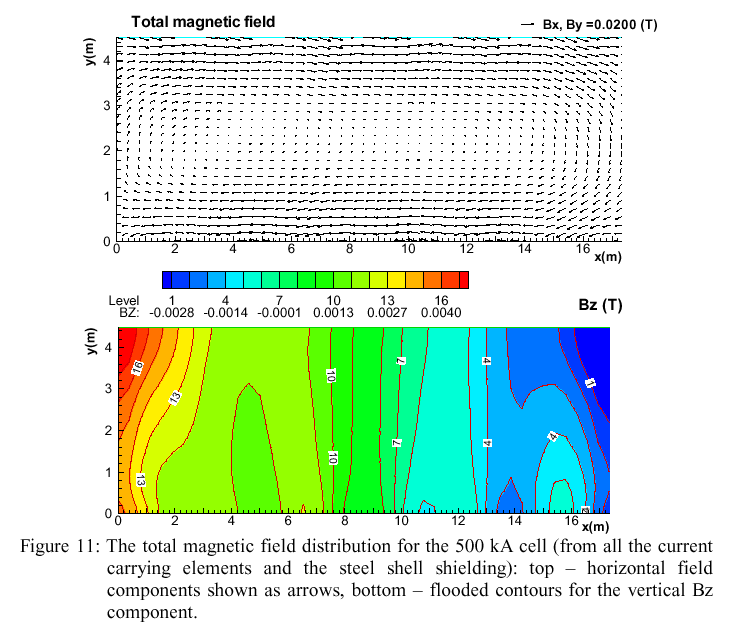
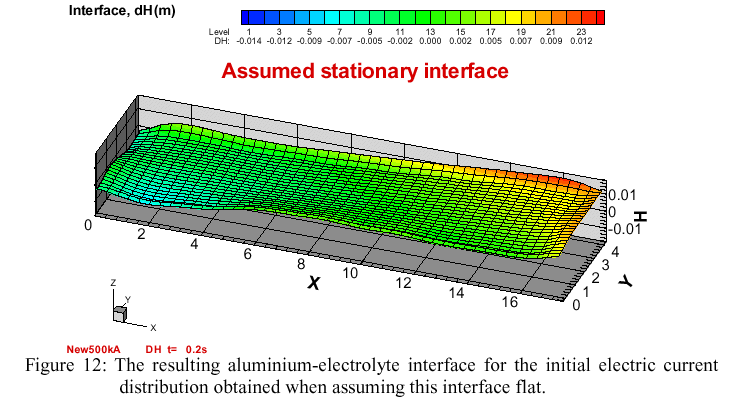
A typical run starts with a flat metal surface. The current distribution and the corresponding magnetic field from all the current-carrying parts of the cell, its neighbors and the return line are computed for this situation. Then the magnetization is computed for the cell steel parts, and the magnetic field additionally corrected by this effect. This total magnetic field distribution for the 500 kA cell is shown in Figure 11. The obtained electromagnetic force distribution permits now to compute the liquid aluminium surface deformation, shown in Figure 12, which we will call the 'assumed stationary interface' (a stationary MHD model would stop at this). Actually, the electric current needs to re-adjust to the new ACD distribution in the cell. The transient adjustment takes some time (200-300 s). If the cell would be ideally stable, we will achieve a stationary interface position and a corresponding current distribution. However, in a real cell the wave damping is complicated by the presence of the predominantly horizontal re-circulating fluid flow.
The velocity is generated in the fluid layers, which gradually grows with time until the viscosity will give sufficient dissipation of the electromagnetic momentum input. The flow becomes turbulent for the typical conditions of the electrolysis cell, and the actual MHD model uses the 2 equation , so called 'k-w', time dependent turbulence model to account for this. The k-w turbulence model is validated experimentally, and we have used it in various MHD applications [3].
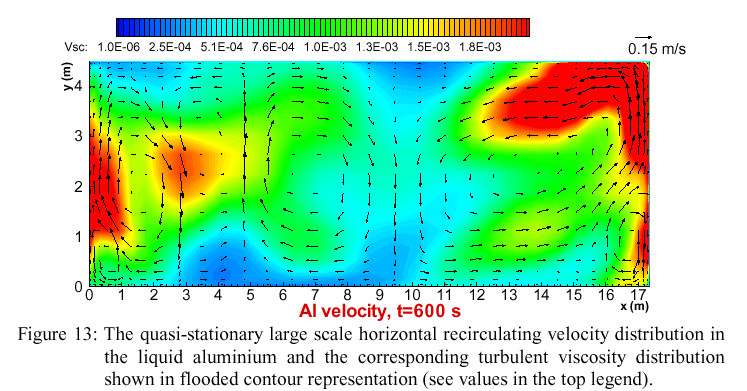
The velocity fields both in aluminium and the electrolyte reach a more or less stationary state, which for the aluminium case is shown in Figure 13. The highly non-uniform distribution of the effective turbulent viscosity is shown by the color flooded contour lines. The regions of high turbulent viscosity mean also a highly increased heat and mass transport for these vicinities, which is important when predicting the thermal losses and the cell wall erosion.
However, the flow is just quasi-stationary, because the interface wave is maintained by the inertia and the continuous electric current adjustment as opposed to the turbulent friction damping. The MHD model is designed to simulate this behavior and to determine if the particular cell under investigation will remain stable, the oscillation will be damped to a very small amplitude level (quite often detectable in careful measurements of the anodic current fluctuations). If the cell is not correctly designed, the interface wave continues to grow and the cell is unstable. For instance, the present 500 kA cell with a symmetric bus network (without the return line magnetic compensation) will be unstable and not suitable for operation.
There are more subtle interactions which are included in the model. One of these is the horizontal large scale circulation influence on the interface deformation: a large scale horizontal vortex will create a considerable free surface dip in its center. Since the circulation pattern in the aluminium layer is different from the electrolyte, the interface adjusts to the pressure deviation created by the large horizontal vortices. The other important effect included in the MHD model is the additional electric current generated by the moving liquid metal (of high electrical conductivity) in the quite strong magnetic field for the case of 500 kA and higher amperage. This second effect is stabilizing the cell fluid dynamics.
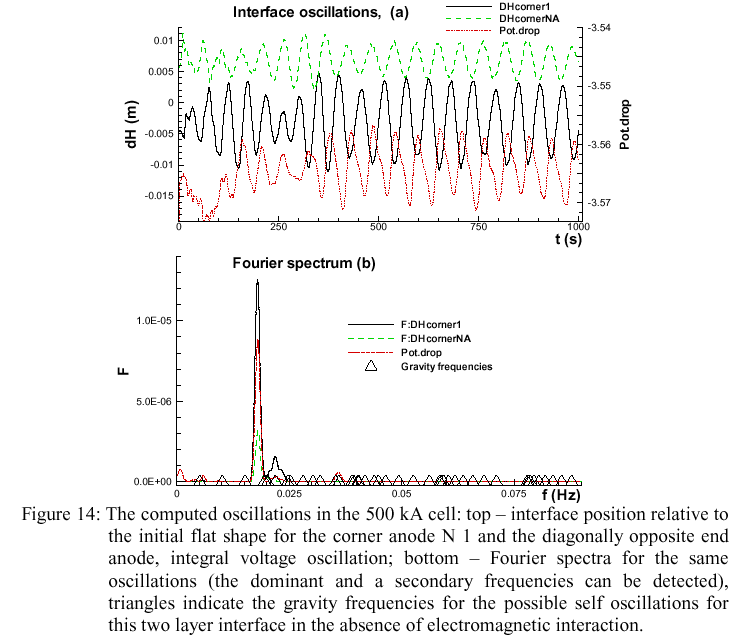
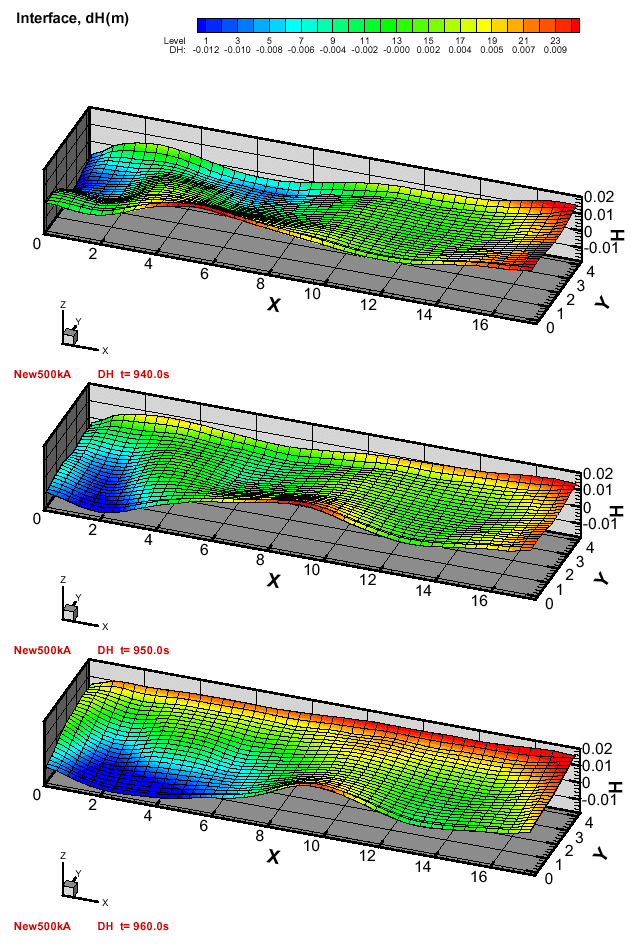
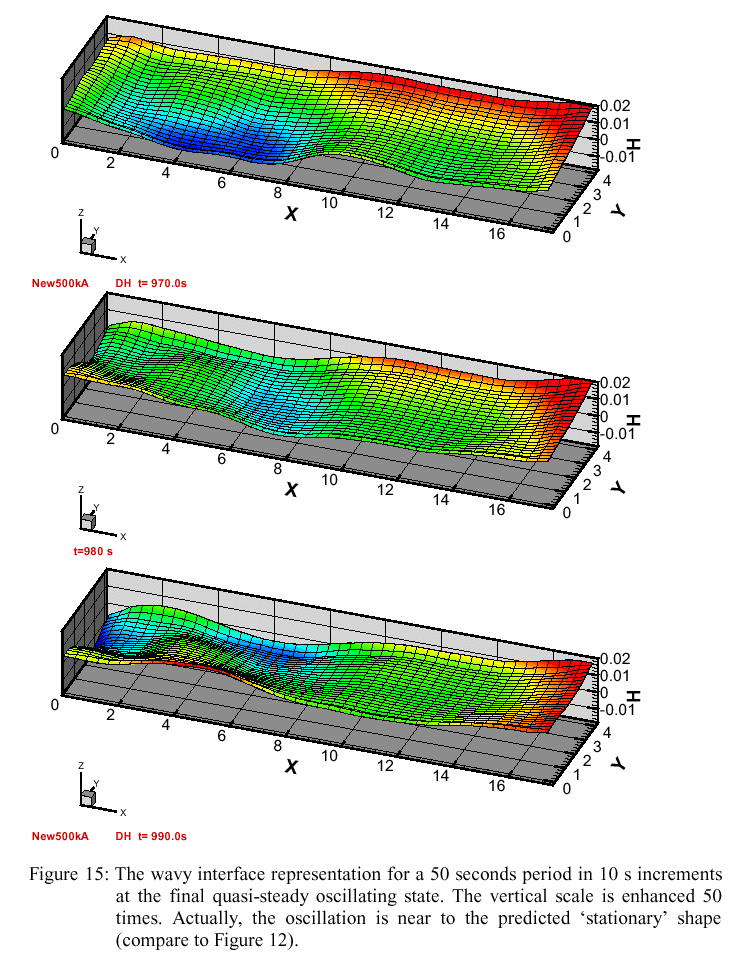
With all these effects included, the cell MHD behavior is stable; however the wave is not eliminated completely in this case, remaining at about 1 cm amplitude above the initial flat surface. The oscillation patterns beneath the first corner anode and the diagonally opposite far corner anode are shown in the top part of the Figure 14. The respective anodic currents fluctuate in the same manner. The Fourier spectrum for this oscillation indicates a dominant frequency between the third and fourth gravitational frequencies, which is shifted, owing to the MHD interaction, from the purely hydrodynamic oscillation frequencies, as it is explained in [10].
The nature of the wave is illustrated for one complete period (about 50 s) in Figure 15, showing the highly exaggerated interface deformation (the scale in z-direction is enhanced 50 times) at 10 second intervals at the end of simulation when a well established turbulent fluid flow is predicted. There is a very small (but detectable in measurements) cell voltage oscillation (Figure 15) which is the result of the integral resistivity change for the ACD during the wave motion.
CONCLUSIONS
State of the art 3D thermo-electric and MHD models have been successfully used to produce a demonstration design of a 500 kA Al electrolysis cell. As the aim of the present study was not to produce an optimized design, that demonstration design could easily be improved. On the thermal side, replacing the 3 studs (20.5 cm of diameter) anode design by a 4 studs (17.5 cm of diameter) one will help. On the MHD cell stability side, the presented busbar layout is still quite rough, resulting in a Bz configuration where the negative impact of the return line is not fully taken care off.
The aim of the present study was rather to start to investigate the impact of the interaction of both models on the local ledge profile prediction of the thermo-electric model and the current density field calculated by the MHD model and the resulting MHD cell stability prediction.
As the initial step toward that goal, the metal pad current density field predicted by the two independent models can be compared (see the top part of figure 6 and figure 10). As it can be observed, the two metal pad current density field predictions are close but not identical. The thermo-electric model is using a more accurate cathode block/collector bar geometry and a computed ledge profile while the MHD model is using an assumed ledge profile. The thermo-electric model mesh density is also far greater than the one of the MHD model because the MHD model needs to solve the current density thousands of times while the thermo-electric model only needs to solve it around 10 times (ledge geometry convergence loop).
As solving the 3D full cell quarter thermo-electric model took 37 CPU hrs on a Pentium III 800 MHz computed while solving the MHD model took "only" 4 CPU hrs on a Pentium 4 1.4 GHz computer, using a more accurate geometry and a finer mesh in the MHD model can easily be considered to reduce this discrepancy.
The next step would be to use the MHD model fluid flow and especially turbulent viscosity solution to solve a 3D full cell thermo-electric model using local liquids/ledge heat transfer coefficients as proposed in [4].
The local ledge profile obtained from the 3D full cell thermo-electric model could in turn be used by the MHD model to compute its metal pad current density. Depending on the geometry of that local ledge profile, this could have a significant impact on the model predicted MHD cell stability.
REFERENCES