LOW ENERGY CONSUMPTION CELL DESIGNS INVOLVING COPPER INSERTS
AND AN INNOVATIVE BUSBAR NETWORK LAYOUT
Marc Dupuis
GéniSim Inc., 3111 Alger St., Jonquière, Québec, Canada G7S 2M9
marc.dupuis@genisim.com
Keywords: MHD cell stability; busbar design; mathematical modeling; power efficiency; copper collector bars.
Abstract
Two innovations presented by the authors recently at ICSOBA
conferences allow to very significantly reducing both the cathode
and the busbar voltage drop [1,2].
This paper combines the usage of those two innovations with the
usage on the new anode stub hole design presented at the
Aluminiun of Siberia conference [3] to come up with a very low
energy consumption cell design.
Introduction
The author has been involved in the modeling of aluminium
reduction cells for the last 30 years. In 1988, he designed the
cathode of the Alcan A310 prototype cell, the first cell to operate
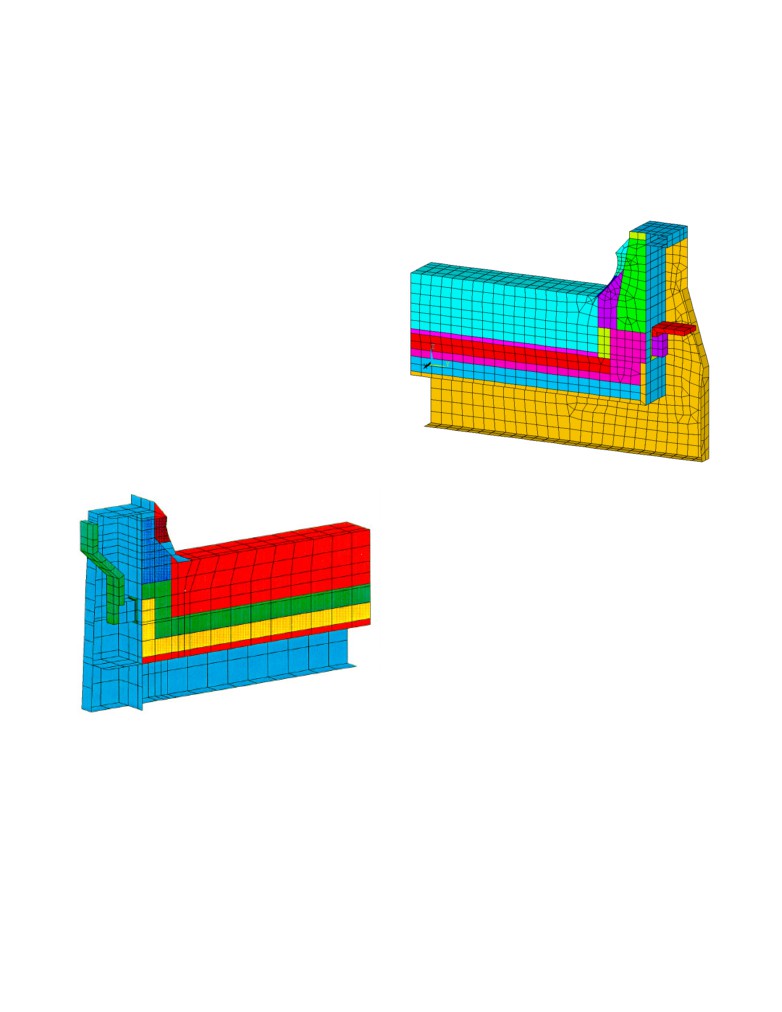
above 300 kA in 1989. The thermo-electric cathode slice model
he developed was presented at the 1991 ANSYS conference [4].
The Figure 6 of that paper, reproduced in Figure 1 shows the
Figure 2: VAW CA300 inspired cathode side slice model mesh
model mesh highlighting the cell lining and potshell design.
That 300 kA demonstration model typical of the early 1990’s state
of the art in cell design became the starting point or base case for
two styles of retrofit studies, the first one aiming at minimizing
the cell energy consumption presented in [6] and the second one
aiming at maximizing the cell productivity presented at the TMS
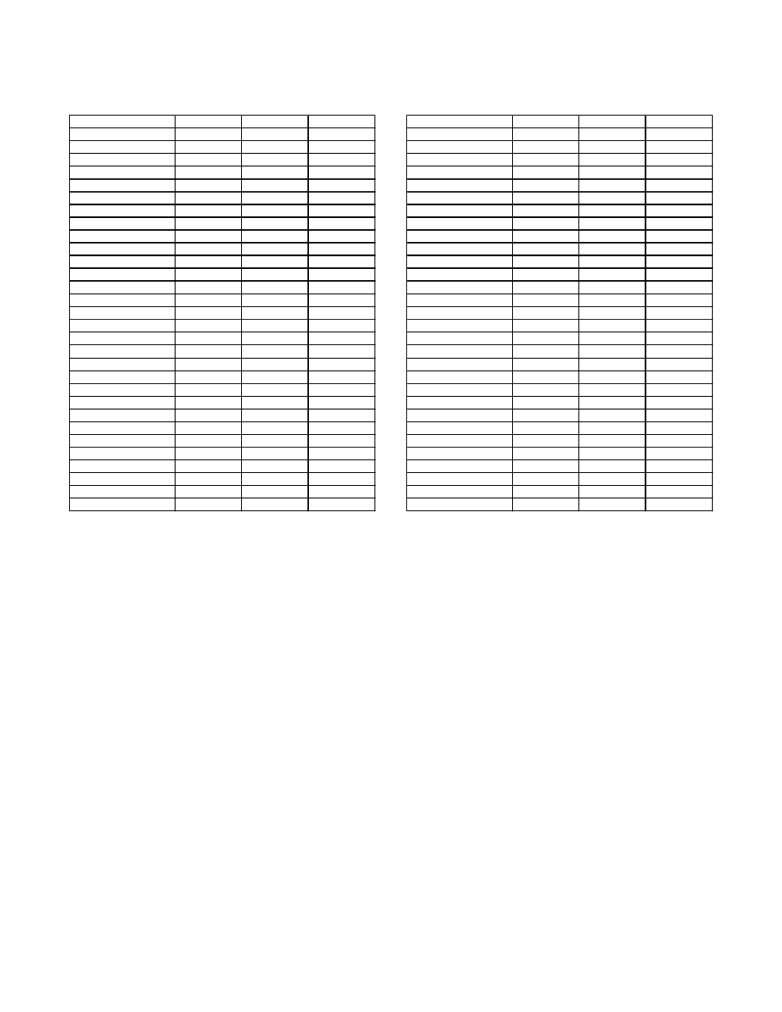
2000 conference [7]. Part of the Table II for a subsequent article
presented in the magazine ALUMINIUM in 2005 [8] presenting
the key design parameters and predicted operational results of
those two cell retrofits is reproduced in Table I.
The key design changes that are allowing either the reduction of
the cell energy consumption to 12 kWh/kg or the increase of the
cell productivity by 17% are the change of the type of cathode
material from 30% to 100% graphitic carbon block, the reduction
of the anode to cathode distance (ACD) from 5 to 4 cm and a
change of the bath chemistry (and alumina feed control logic)
increasing the current efficiency. Other changes are required to
obtain an appropriate ledge thickness at a very different level of
Figure 1: Alcan A310 cathode side slice model mesh
heat dissipation. Per example, the known strategy to increase the
cell productivity is to increase the anode length, decrease the ASD
A few years later as an independent consultant, the author
and use thin silicon carbide side walls. In addition, anode stud
developed a similar demonstration model strongly inspired by the
diameter and collector bar size can be increased while the anode
VAW CA300 cell design presented in JOM in 1994 [5]. The
cover thickness can be decreased.
resulting thermo-electric cathode slice model that was first
presented in Figure
12 of the
1997 CQRDA aluminium
The design strategy to decrease the cell energy consumption to 12
electrolysis course [6] is reproduced in Figure 2.
kWh/kg is the opposite, anode stud diameter and collector bar size
can be decreased while the anode cover thickness can be
The A310 and the CA300 cells were designed at about the same
increased. What is a lot more significant is that the cell
time and operated at about the same amperage. Both designers
productivity must be decreased by 12%, which explains why so
clearly respected similar design guidelines for the choice of the
far the industry have not move in that direction despite the fact
type of cathode blocks and side blocks, the thickness of that side
that operation at that level of power efficiency have been reported
block, the size of the anode to side wall distance (ASD), the
as soon as the early 80’s [9,10].
location of the anode shadow, etc.
Table I: Design and predicted operational data,
Table II: Design and predicted operational data,
part of Table II in [8]
original work presented in [14]
Base case
Base case
Amperage
300 kA
265 kA
350 kA
Amperage
500 kA
500 kA
600 kA
Nb. of anodes
32
32
32
Nb. of anodes
40
48
48
Anode size
1.6 m X 0.8 m
1.6 m X 0.8 m
1.7 m X 0.8 m
Anode size
1.95 m X 0.8 m
1.95m X .665m
2.0m X .665m
Nb. of anode studs
3 per anode
3 per anode
3 per anode
Nb. of anode studs
3 per anode
4 per anode
4 per anode
Anode stud diameter
18 cm
16 cm
19 cm
Anode stud diameter
20.5 cm
17.5 cm
17.5 cm
Anode cover thickness
16 cm
17.5 cm
10 cm
Anode cover thickness
10 cm
10 cm
10 cm
Nb. of cathode blocks
18
18
18
Nb. of cathode blocks
24
24
24
Cathode block length
3.47 m
3.43 m
3.67 m
Cathode block length
4.17 m
4.17 m
4.17 m
Type of cathode block
HC3
HC10
HC10
Type of cathode block
HC10
HC10
HC10
Collector bar size
20 cm X 10 cm
18 cm X 10 cm
20 cm X 10 cm
Collector bar size
20 cm X 10 cm
20 cm X 10 cm
20 cm X 10 cm
Type of side block
HC3
Anthracite
SiC
Type of side block
Si C
SiC
SiC
Side block thickness
15 cm +
15 cm +
10 cm +
Side block thickness
10 cm +
10 cm +
7 cm +
ASD
35 cm
35 cm
30 cm
ASD
30 cm
30 cm
28 cm
Calcium silicate thickness
3.5 cm
6.0 cm
3.5 cm
Calcium silicate thickness
3.5 cm
3.5 cm
3.5 cm
Inside potshell size
14.4 X 4.35 m
14.4 X 4.35 m
14.4 X 4.35 m
Inside potshell size
17.8 X 4.85 m
17.8 X 4.85 m
17.8 X 4.85 m
ACD
5 cm
4.15 cm
4 cm
ACD
4 cm
3.5 cm
3.5 cm
Excess AlF3
10.90%
13.50%
13.50%
Excess AlF3
13.50%
12.00%
12.00%
Anode drop
303 mV
273 mV
323 mV
Anode drop
354 mV
265 mV
318 mV
Cathode drop
285 mV
213mV
292 mV
Cathode drop
314 mV
87 mV
104 mV
Anode panel heat loss
240 kW
183 kW
284 kW
Anode panel heat loss
409 kW
420 kW
449 kW
Cathode bottom heat loss
176 kW
132 kW
202 kW
Cathode bottom heat loss
273 kW
238 kW
240 kW
Operating temperature
973.2 °C
956.1 °C
960.4 °C
Operating temperature
963.1 °C
955.6 °C
964.8 °C
Liquidus superheat
6.7 °C
2.4 °C
6.7 °C
Liquidus superheat
9.4 °C
2.6 °C
11.8 °C
Bath ledge thickness
8.66 cm
23.5 cm
9.09 cm
Bath ledge thickness
6.15 cm
29 cm
4.76 cm
Metal ledge thickness
4.12 cm
9.01 cm
4.42 cm
Metal ledge thickness
2.42 cm
26 cm
1.07 cm
Current efficiency
94.00%
95.70%
96.10%
Current efficiency
95.90%
96.50%
96.40%
Internal heat
628 kW
422 kW
713 kW
Internal heat
1043 kW
760 kW
1140 kW
Energy consumption
13.72 kWh/kg
11.93 kWh/kg
13.43 kWh/kg
Energy consumption
13.61 kWh/kg
12.1 kWh/kg
13.26 kWh/kg
Clearly, a cell designer cannot at the same time aim at maximizing
New retrofit study aiming at minimizing cell energy
the cell productivity and minimizing the cell energy consumption.
consumption even further
This is why Rio Tinto per example has developed and is offering
both the AP60 and the APXe cells based on the same basic
In the past 30 years, the market conditions of high metal value and
platform [11].
the existence of regions of the world offering inexpensive
electrical power were favorable for new cell designs maximizing
Yet, new choice of materials and new and innovative design ideas
cell productivity while maintaining power efficiency in the 13-
can always be put to contribution in order to further increase the
13.5 kWh/kg range.
cell productivity or decrease the cell energy consumption.
Another tendency is to continue to increase the cell size in order
The market conditions have evolved recently to a much lower
to keep reducing both the cell OPEX and CAPEX. It is in that
metal value and far less availability of inexpensive electrical
power. In that context, the metal production cost is getting quite
context that the AP60 platform replaced the AP30 platform that
itself replaced the AP18 platform [12] per example.
close to the metal market value and a reduction of the energy
consumption can make the difference between operating at profit
For one, the author have been advocating that, despite the
or at loss.
difficulties that have always been limiting the rate of increase of
Technically, 12-12.5 kWh/kg have been achieved multiple times
the cells size since the beginning of the industry, he could foresee
no technical limitation that could limit further increase of cell size
and as for operation at 13-13.5 kWh/kg range, under the current
in the future. It is in that context that the author presented a 500
market conditions it might well become the preferable operational
range. The next question is technically, regardless of market
kA cell design in 2003 in [13] and a 740 kA cell design in 2005 in
[8].
conditions, how much lower can we manage to go?
Reducing the cell energy consumption means reducing the cell
In yet another cell retrofit demonstration study paper in 2011 [14]
the author took advantage of new design innovations like collector
voltage drop which in turn means reducing the cell ohmic
bar copper inserts, anode slots and a new type of anode stub hole
resistance. This statement assumed that at
95-96% current
efficiency, we cannot expect significant gain to come from that
design [3] to retrofit the 500 kA cell presented in [13] into a more
productive
600 kA cell operating at about the same power
factor. Leaving aside the bath ohmic resistance for now, this
efficiency. As an intermediary step not quite optimized in term of
leaves three distinct ohmic resistances to work with: the anode,
cathode and busbar resistances.
thermal conditions, a 500 kA cell operating at
12.1 kWh/kg was
also developed. Table II presents detailed data of that study.
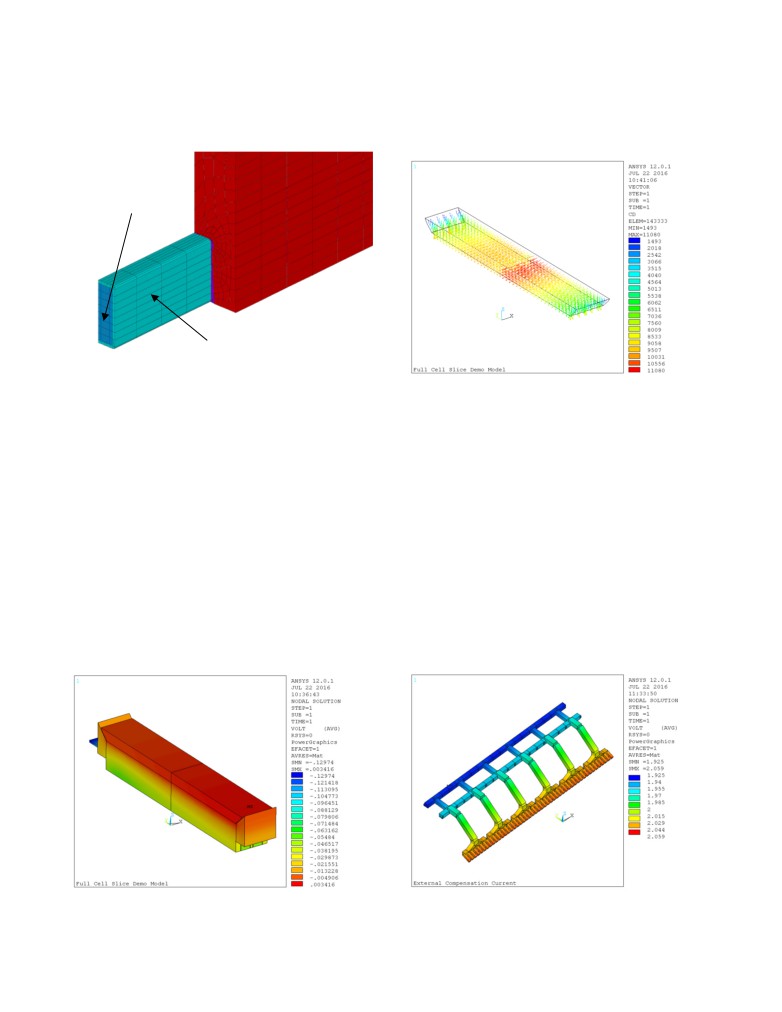
Cathode design with copper collector bars
Figure 5 presents the horizontal currents in the metal pad. They
As presented in Table II, the intermediary cell operating at 500 kA
have been reduced as compared to those presented in Figure 2 of
presented in [14] was operating at 87 mV at cathode drop by using
[2]. Unfortunately, the center channel creates a gap that prevents
the copper collector bars design presented in Figure 3.
the total elimination of a horizontal component in the metal pad
current regardless of the size of the copper collector bars used.
copper
steel
Figure 3: Copper collector bar design originally proposed in [14]
At the time, it was speculative that such a collector bar design
Figure 5: Metal pad current density
could be actually build, but it is no longer the case today after
Storvik AS presentation at the ISCOBA 2015 conference [15].
External compensation current (ECC) busbar network design
Furthermore, at the TMS 2016 conference KAN-NAK advocated
that copper collector bars don’t even need to be protected by a
As presented in
[2], the idea of taking advantage of copper
shell of steel [16].
collector bars to extract
100% of the cell current on its
downstream side came to the author as a way to reduce of busbar
As first presented in [2], what the author did not realized in 2011
weight of its own reversed compensation current (RCC) busbar
is that with the usage of copper collector bars, 100% of the cell
configuration.
current can be extracted on the downstream side without
generating excessive horizontal current in the metal pad or
It happens that the same idea is easily applicable to existing ECC
producing excessive cathode voltage drop.
busbar configurations. In that case, the busbar network is reduced
to only the anode risers so it is the preferable busbar configuration
The results presented in [14] and in [2] are for a 20 cm x 10 cm
if the main goal is to minimize the busbar voltage drop in order to
copper collector bar size. When the current is extracted all on the
minimize the cell energy consumption.
downstream side of that cell running at
500 kA, the current
density in the bar doubles, and the cathode voltage drop increases
Figure 6 presents the busbar network and the calculated busbar
from 87 mV to 174 mV as presented in [2].
drop of 134 mV. The busbar current density is quite low but this is
consistent with a business scenario where the metal cost is low
New results for a bigger 25 cm x 16 cm copper collector bar are
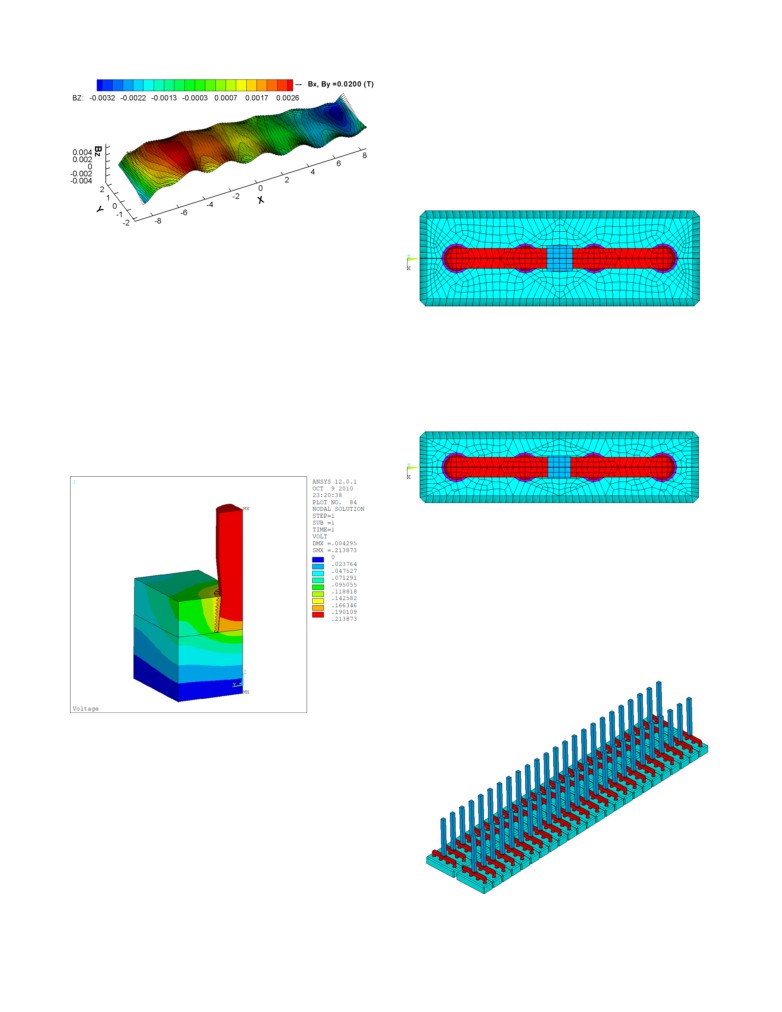
and the energy cost is high. Figure 7 is presenting the vertical
presented here. As can be seen in Figure 4, the cathode voltage
component of the magnetic field (Bz) obtained while using this
drop is reduced back to 130 mV.
busbar configuration (see [2] for more results).
Figure 6: Busbar drop of the ECC busbar network concept with
Figure 4: Cathode voltage drop
100% downstream side current exit
disappointing. It turned out that the best way to achieve more mV
saving was to improved the anode aspect ratio.
Figure 9 is presenting the current anode aspect ratio, each stub is
feeding a rectangular carbon section of 0.4875 m x 0.665 m, and
ideally, each stub should be feeding a square section of carbon.
This is important since with 4 fairly big stubs and the new stub
hole design, the biggest resistance is now in the carbon section of
the anode.
Figure 7: Vertical component of the magnetic field (Bz), Figure 10
in [2]
Anode design with innovative stub hole conception
As presented in [14] and in Table II, when operating the cell at
500 kA using 48 anodes of 1.95 m x 0.665 m, the predicted
Figure 9: One of the 48 1.95 m x 0.665 m anode
voltage drop is 265 mV. This already very low anode drop is in
great part due to the usage of an innovative stub hole conception.
For that reason, the 48 1.95 m x 0.665 m anodes have been
That innovative conception was tested in a thermo-electro-
replaced with 64 1.95 m x 0.5 m anodes keeping the exact same
mechanical (TEM) model presented in [17]. Figure 4 of [14] is
stub diameter and stub hole design in order to avoid to go back
showing the voltage drop prediction from that TEM model but not
running the TEM model. Figure 10 presents the new anode aspect
the new stub hole design investigated.
ratio.
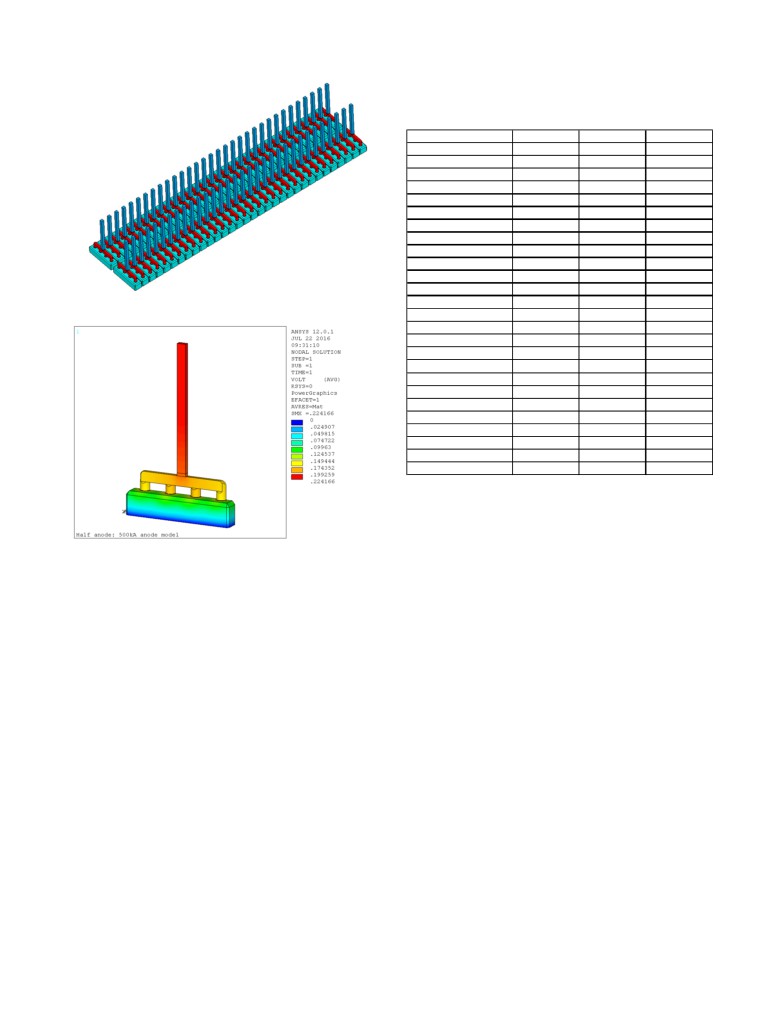
That design has been presented for the first time in [3]. Figure 8 is
presenting the original ANSYS voltage drop figure of the TEM
model testing that new stub hole design concept.
Figure 10: One of the 64 1.95 m x 0.5 m anode
With a parametric model at your disposal, the half anode model
can be modified in no time. The same is true for the full anode
panel model. Figure 11 is presenting the initial 48 anodes panel
layout while Figure 12 is presenting the new 64 anodes panel
layout.
The resulting anode voltage drop is presented in Figure 13, simply
by changing the anode aspect ratio and by increasing the number
of anodes from 48 to 64, the anode voltage drop has been reduced
from 265 mV to 224 mV.
Figure 8: Anode voltage drop from the TEM model
As discussed in [3], the aim of the new design is to get a good
contact pressure between the stub bottom horizontal face and the
anode stub hole bottom horizontal face. This is achieved by
locking the stub vertical thermal expansion. As presented in [3],
there is more that one way to achieve this, the final optimized
shape presented in
[3] is less costly to implement, but was
developed after [14] was written.
From that starting point, the author tried to further reduce that
anode voltage drop for this study. The option to add copper insert
like the one presented in [15] was investigated but the gains were
Figure 11: 48 anodes panel layout
Table III: Design and predicted cell energy consumption
Base case
Amperage
500 kA
500 kA
400 kA
Nb. of anodes
48
64
64
Anode size
1.95m X .665m
1.95m X .5m
1.95m X .5m
Nb. of anode studs
4 per anode
4 per anode
4 per anode
Anode stud diameter
17.5 cm
17.5 cm
17.5 cm
Anode cover thickness
10 cm
10 cm
10 cm
Nb. of cathode blocks
24
24
24
Cathode block length
4.17 m
4.17 m
4.17 m
Type of cathode block
HC10
HC10
HC10
Collector bar size
20 cm X 10 cm
25 cm X 16 cm
25 cm X 16 cm
Type of side block
Si C
SiC
SiC
Figure 12: 64 anodes panel layout
Side block thickness
10 cm +
10 cm +
10 cm +
ASD
30 cm
30 cm
30 cm
Calcium silicate thickness
3.5 cm
3.5 cm
3.5 cm
Inside potshell size
17.8 X 4.85 m
17.8 X 4.85 m
17.8 X 4.85 m
ACD
3.5 cm
3.2 cm
3.2 cm
Excess AlF3
12.00%
12.00%
12.00%
Anode drop
265 mV
224 mV
179 mV
Cathode drop
87 mV
130 mV
104 mV
Busbar drop
310 mV
134 mV
107 mV
Cell voltage
3.89 V
3.59 V
3.20 V
Current efficiency
95.90%
95.90%
95.90%
Internal heat
758 kW
699 kW
414 kW
Energy consumption
12.1 kWh/kg
11.2 kWh/kg
9.95 kWh/kg
In order to make the new cell lining design work even more
challenging and the cell energy savings even more impressive,
Table III also reports results for an operation at
400 kA
corresponding to running at only 0.64 A/cm2 of anode current
Figure 13: Anode voltage drop from the TE model
density. At that current density and still at 3.2 ACD, the cell is
expected to produce metal using only 9.95 kWh/kg.
Calculation of the resulting cell energy consumption
The corresponding cell internal heat is calculated to be reduced to
Several modeling tools could be used to calculate the cell energy
414 kW which is only 36% of the 1140 kW dissipated by the
consumption from the above results. In
[14] the author used
same cell “platform” running at 600 kA and 13.26 kWh/kg.
Dyna/Marc
[18] which also predicts the cell superheat and
corresponding ledge thickness.
Conclusions
So far no effort has been made to adjust the cell lining design to
Two innovations presented by the authors recently at ICSOBA
the new cell operating conditions so a simple cell voltage break
conferences allow to very significantly reducing both the cathode
down tool like Peter Entner’s CellVolt [19] was used instead.
and the busbar voltage drop:
Table III presents the results obtained for the operation at 500 kA
- cathode design with copper collector bars extracting 100%
corresponding to running at 0.8 A/cm2 of anode current density.
of the cell current on its downstream side
- the usage of modified external compensation current
As in [2], the calculation was done using 3.2 cm of ACD instead
(ECC) busbar configuration made only of anode risers;
of 3.5 cm used in [14] as since 2011, indications are that ACD
have been reduced further more in low energy consumption cell
are combined with a third innovation presented at the Aluminiun
prototypes. At
3.2 cm ACD, the predicted cell energy
of Siberia conference:
consumption is calculated to be 11.2 kWh/kg.
- the usage of a new anode stub hole design.
More significantly, the cell internal heat is calculated to be only
As a result, a cell operating at 500 kA, 0.8 A/cm2 of anode current
699 kW while the cell lining was designed to comfortably
density and
3.2 cm ACD is predicted to have an energy
dissipate 1140 kW with 20 cm x 10 cm size collector bars and 192
consumption of about 11.2 kWh/kg.
anode stubs. Clearly a very serious cell lining redesign work
needs to be performed as the next step. New insulating materials
The same cell platform operating at 400 kA, 0.64 A/cm2 of anode
like the ceramic fire board extensively used in [20] will certainly
current density and 3.2 cm ACD is predicted to have an energy
need to be added to the list of lining materials.
consumption of about 9.95 kWh/kg.
References
[15] Dag Sverre Sæsbøe, “Storvik high conductivity anode yoke
with copper core”, Proceedings of
33rd International
[1] M. Dupuis, “A New Aluminium Electrolysis Cell Busbar
ICSOBA Conference, Travaux No.
44, Dubai, UAE,
29
Network Concept”, Proceedings of
33rd International
November - 1 December 2015, Paper AL23.
ICSOBA Conference, Travaux No.
44, Dubai, UAE,
29
November - 1 December 2015, Paper AL21.
[16] R. von Kaenel and al., “Copper Bars for the Hall-Héroult
Process”, TMS Light Metals, 2016, 903-908.
[2] M. Dupuis,
“New Busbar Network Concepts Taking
Advantage of Copper Collector Bars to Reduce Busbar
[17] M. Dupuis, “Development and application of an ANSYS
Weight and Increase Cell Power Efficiency”, Proceedings of
based thermo-electro-mechanical anode stub hole design
34th International ICSOBA Conference, Travaux No. 45,
tool”, TMS Light Metals, 2010, 433-438.
Quebec, Canada, 2 - 5 Octobre 2016, to be published.
[18] M. Dupuis and H. Côté, “Dyna/Marc 14.0 User’s guide”,
[3] M. Dupuis, “Presentation of a New Anode Stub Hole Design
GeniSim, 2012.
Reducing the Voltage Drop of the Connection
by 50 mV”, VIII International Congress & Exhibition “Non-
Ferrous Metals and Minerals”, Krasnoyarsk, Russia, 13 - 16
entner.com/ug/windows/cellvolt/toc.aspx
September 2016, to be published.
[20] J. Zhou and M. Dupuis,
“In-Depth Analysis of Lining
[4] M. Dupuis and I. Tabsh, “Thermo Electric Coupled Field
Designs for Several 420 kA Electrolytic Cells”, TMS Light
Analysis of Aluminum Reduction Cells Using the ANSYS
Metals, 2015, 685-690.
Parametric Design Language”, Proceeding of the ANSYS®
Fifth International Conference, volume 3, 1991, pp. 17.80
17.92
[5] V.A. Kryukovski, G.A. Sirasutdinov, J. Klein and G.
Peychal-Heiling,
“International Cooperation and High-
Performance Reduction in Siberia”, JOM, 46(2), 1994, 23-
25.
[6] M. Dupuis,
“Les modèles thermiques”,
2e Symposium
québécois sur le procédé d’électrolyse de l’aluminium,
CQRDA, 1997.
[7] M. Dupuis, “Thermo-Electric Design of a 400 kA Cell Using
Mathematical Models: A Tutorial”, TMS Light Metals, 2000,
297-302.
[8] M. Dupuis, “Thermo-Electric Design of a 740 kA Cell, Is
There a Size Limit”, ALUMINIUM 81(4), 2005, 324-327.
[9] O. Fujishima, M. Takasawa and K. Wakaizumi, “Advanced
Energy Saving in Aluminum Reduction Cell”, AIME Light
Metals, 1982, 559-569.
[10] S. Tanji, O. Fujishima, K. Mori, “Substantial Energy Saving
in Existing Potlines”, AIME Light Metals, 1983, 577-586.
[11] “AP60 and APXe: A breakthrough in productivity, energy
consumption and emissions”, AP TechnologyTM Fact sheet,
March 2015.
[12] F. Charmier, O. Martin and R. Gariepy, “Development of the
AP Technology Through Time”, JOM, Vol. 67, No. 2, 2015,
336-341.
[13] M. Dupuis, “Thermo-Electric Design of a 500 kA Cell”,
ALUMINIUM 79(7/8), 2003, 629-631.
[14] M. Dupuis and V. Bojarevics, “Retrofit of a 500 kA cell
design into a 600 kA cell design”, ALUMINIUM 87(1/2),
2011, 52-55.