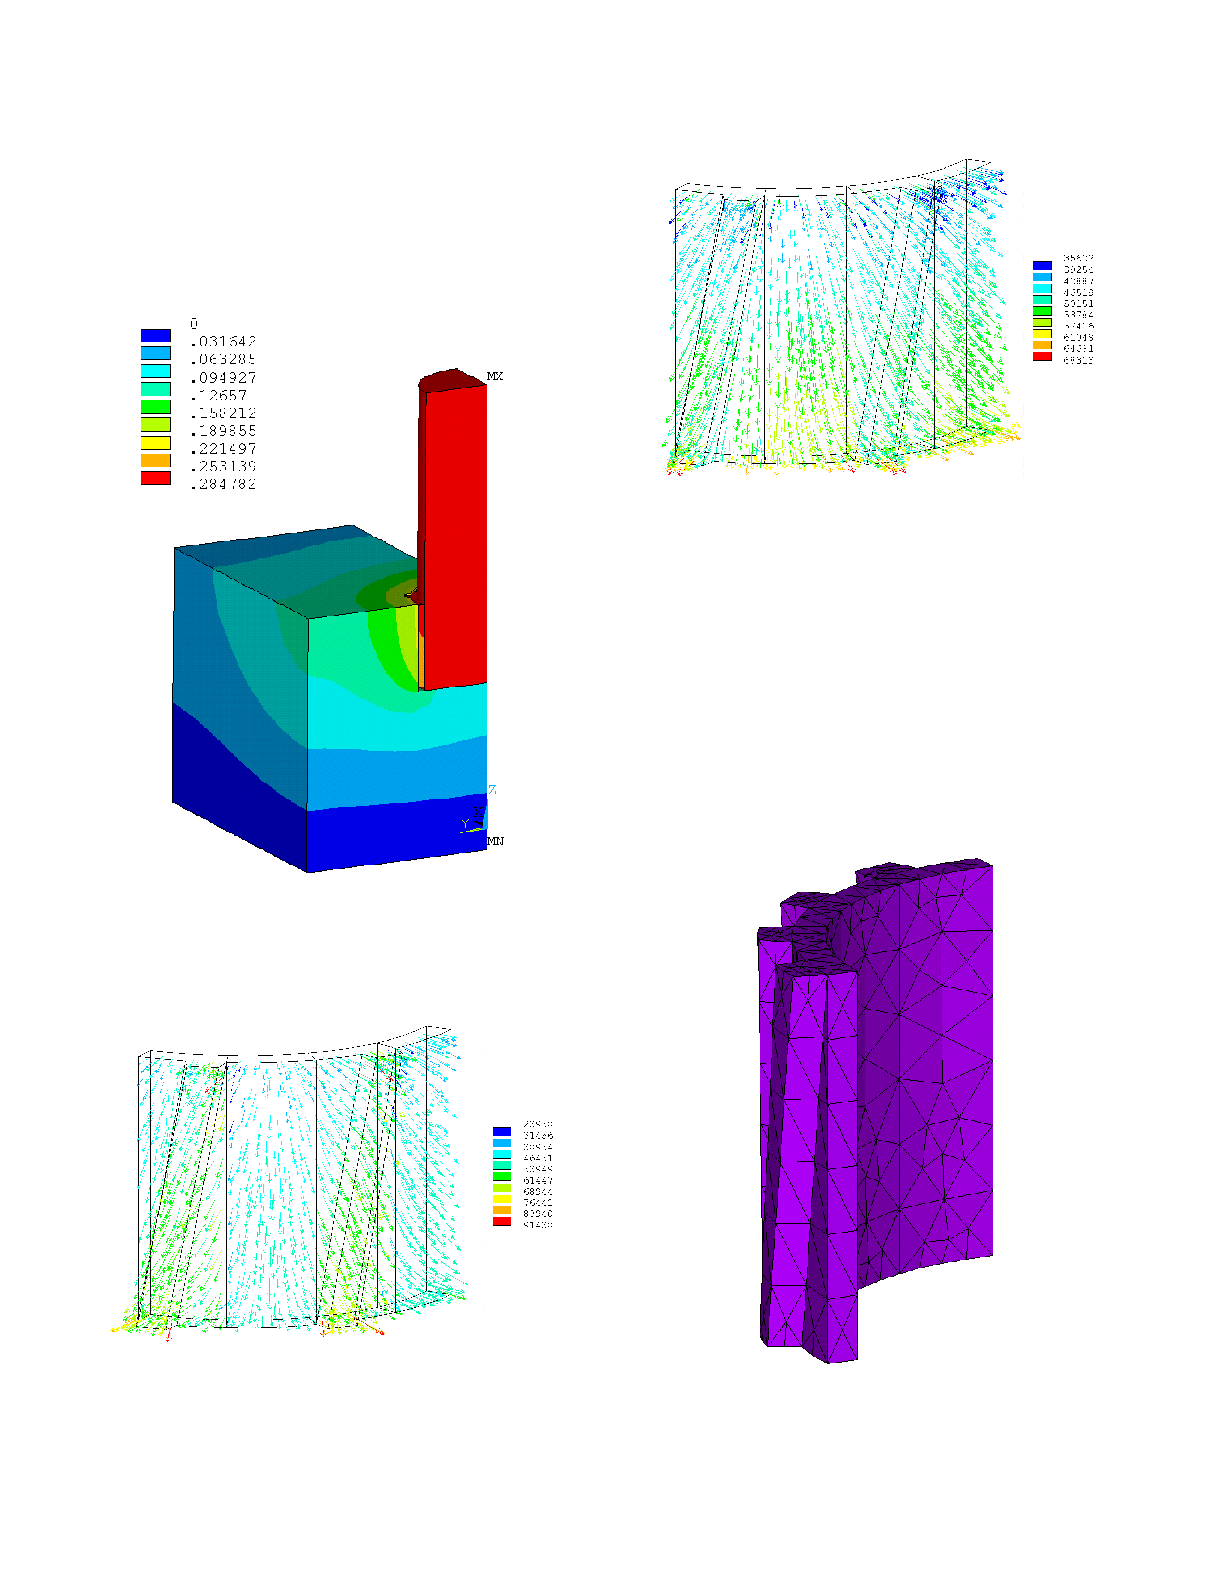
resistance %table% setup was activated. The model voltage drop
prediction in those conditions is 285 mV (see figure 4). The two
runs predict about the same voltage drop indicating that the 2
micro-ohm m2 is very close to the average contact resistance value
comparing the current density distribution in the cast iron that a
significant redistribution of the current path has occurred.
model setup and the pressure and temperature
dependant model setup (A/m2)
was used (see cast iron mesh in figure 6). When using "classic" TE
models with constant contact resistance setup, adding more flutes is
always better because it is increasing the cast iron/anode carbon
interface contact surface hence decreasing the predicted voltage
drop regardless of the flutes geometry.