-8
-4
0
4
8
12
0
120
240
360
480
600
720
Time [min]
920
930
940
950
960
970
Voltage
Superheat
Temperature
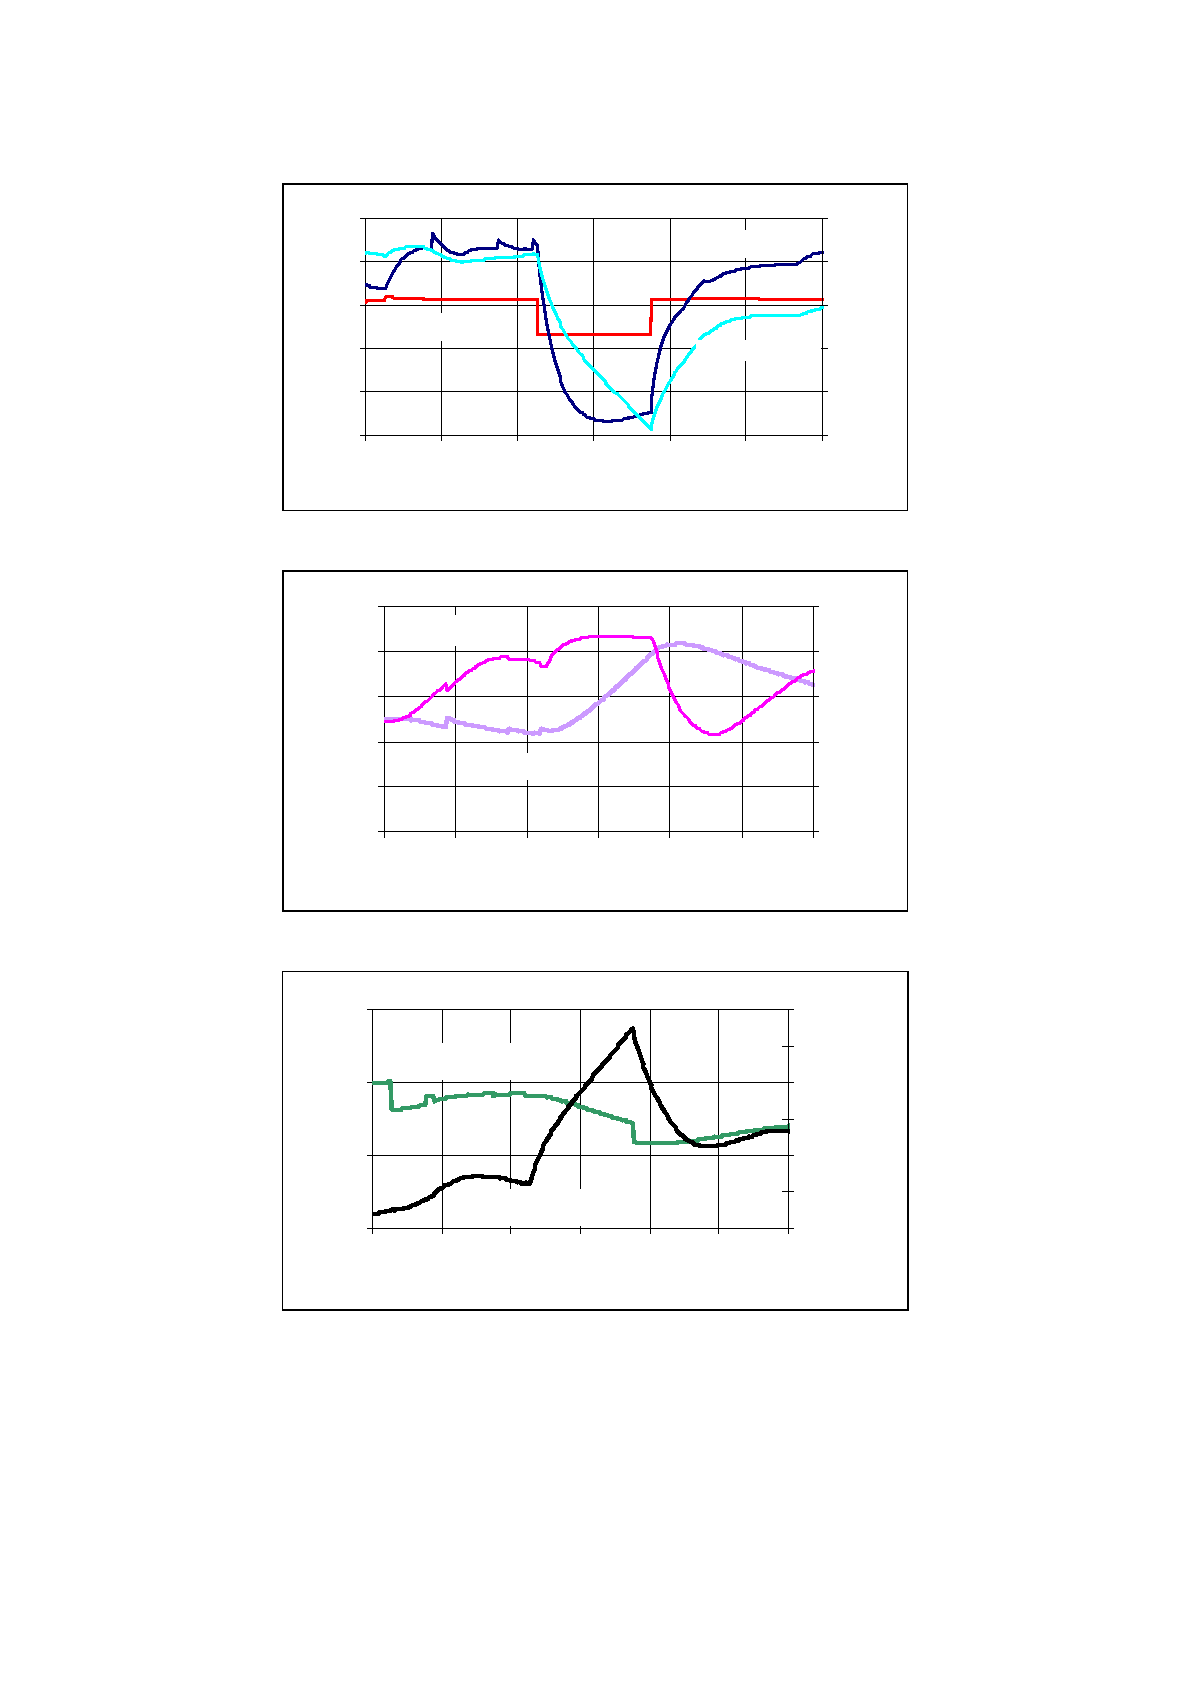
Figure 5a: Bath temperature and superheat
5
7
9
11
13
15
0
120
240
360
480
600
720
Time [min]
0
1
2
3
4
5
xc. AlF3
Alumina conc.
Figure 5b: Concentration of excess AlF3 and alumina
0.0
0.1
0.2
0.3
0
120
240
360
480
600
720
Time [min]
0.43
0.44
0.45
0.46
0.47
0.48
0.49
Bath level
Bath resistance
Figure 5c: Bath level and resistance
On increasing the pot voltage for additional heating, the superheat (blue line, left-hand axis)
rises by 4°C until the power is shut down, Figure 5a. The voltage curve (red line) indicates
the power disconnection time. The bath temperature (cyan line and right-hand axis) drops
from 960 to 920°C in 3 hours, resulting in additional ledge formation and an increased
concentration of excess AlF3 (violet line) in the remaining bath, as shown in Figure 5b. The