simulators, i.e. the Dyna/Marc lump/1D cell simulator and the ANSYS-based 2D+ dynamic
cell simulator [4,5,6,7,8].
the evolution of the anode-cathode distance (ACD) into account. To model the reduction
process, 36 totally differential equations were solved using the Euler numerical scheme. To
evaluate the required first order derivative of these main 36 variables, large numbers of
derived variables were calculated in sub-models using equations published in the literature.
be calculated. While computation of the internal heat generation is relatively straightforward,
determination of the cell heat loss is more difficult. Dyna/Marc uses a lump/1D formulation in
which it is assumed that the heat produced in the system can escape from four different
surfaces, namely the anode panel, the cathode panel, the ledge at bath level and the ledge at
metal level. The overall heat transfer rate across each surface is the quotient of its global heat
transfer resistance and its associated gradient between the operating temperature and the
potroom temperature. For the two "vertical" surfaces, i.e. the ledge at bath level and the ledge
at metal level, the ledge thickness constantly fluctuates, meaning that the global heat transfer
resistance for these two surfaces is not constant.
simulator in every aspect except for the cell heat loss sub-model. The ANSYS-based 2D+
dynamic cell simulator is an ANSYS-based heat loss sub-model where the "+" in the 2D+
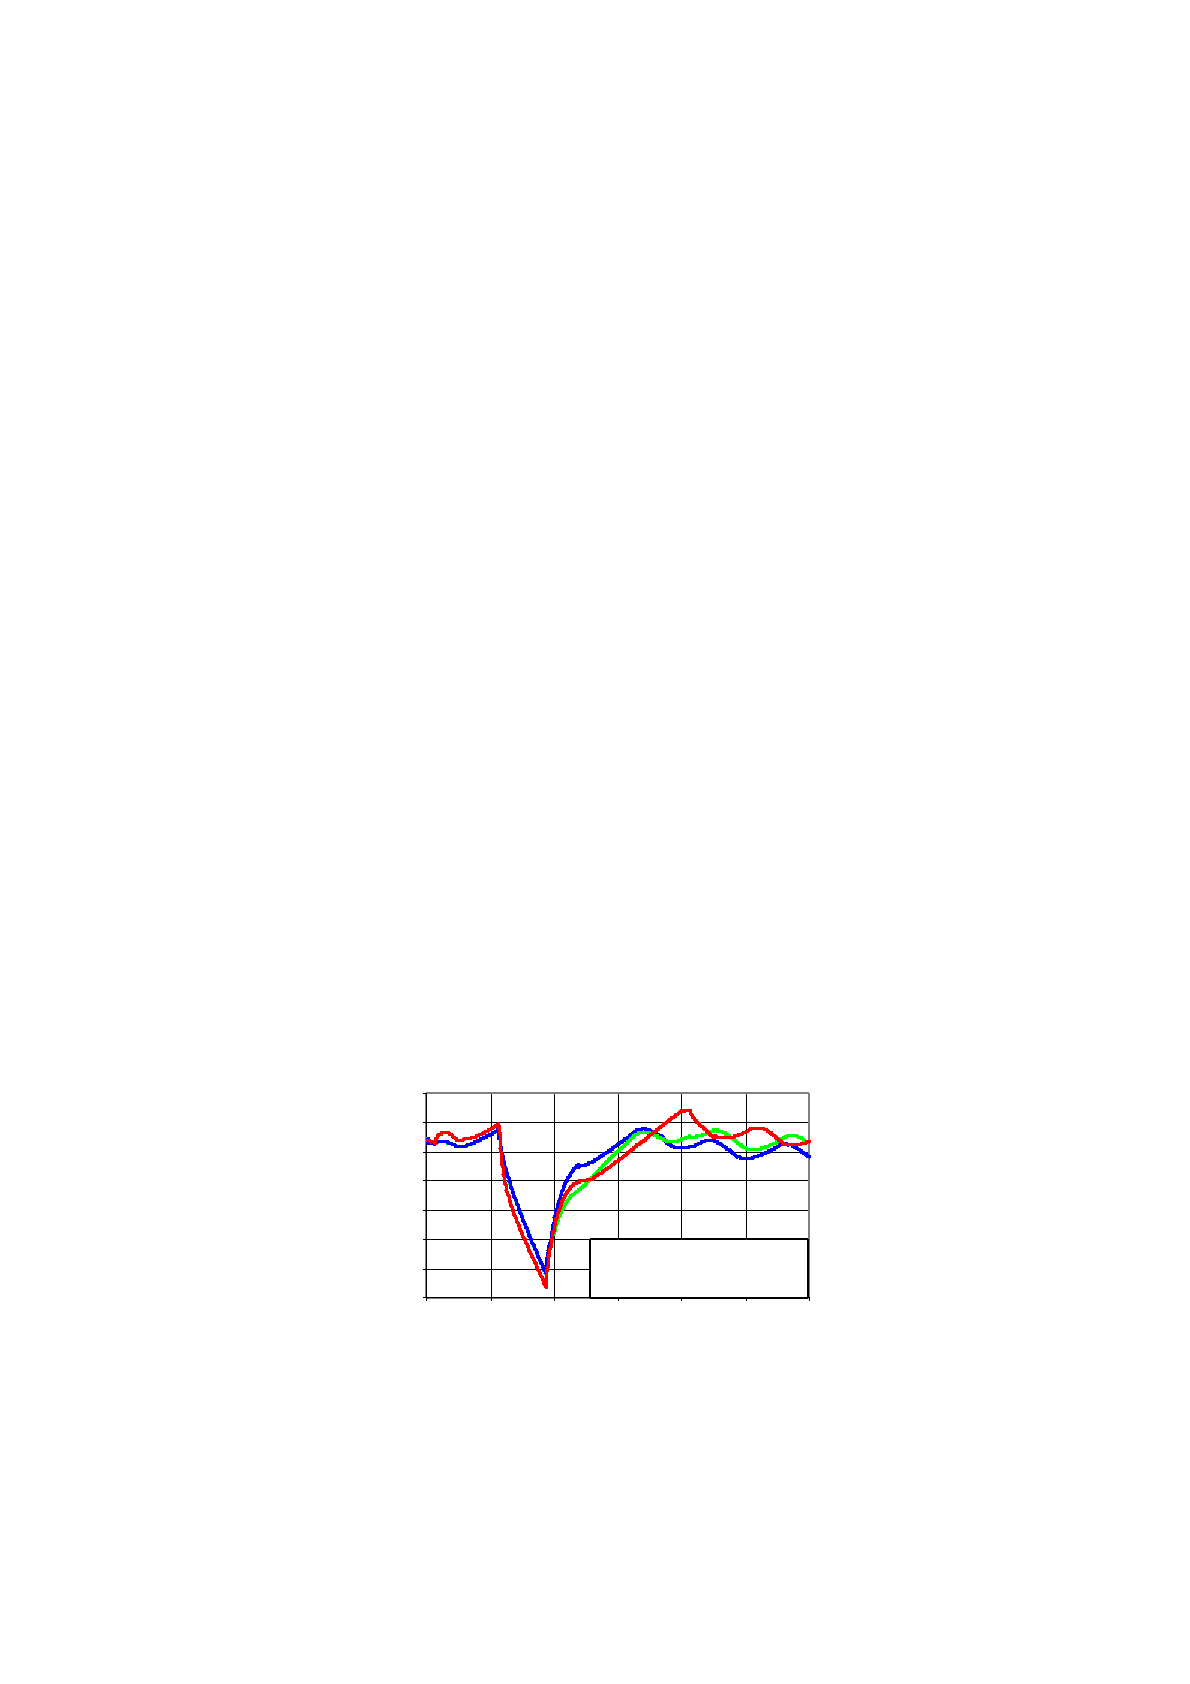
model stands for some crude representation of the third dimension in a 2D model. Figure 2
presents the 24-hour thermal response of both the Dyna/Marc lump/1D dynamic model and
the corresponding ANSYS-based 2D+ dynamic model. Both models used 2-minute time
steps. Since the 2D+ model response displayed some signs of instability, the model was rerun
- this time using 1-minute time steps. The change eradicated the instabilities and produced an
identical response up to the point where the cell controller took a different decision (based on
a different resistance slope evaluation) after the power shutdown.
response is almost identical to that of the ANSYS-based 2D+ model, which took far more
computational time (hours instead of seconds). Figure 3 directly compares the Dyna/Marc-