center of the block are significant, as shown in Figure 10; they will generate upward bending of
the block, which has an effect on the electrical solution for the modeled configuration, as will be
seen later.
0
50
100
150
200
250
300
350
400
0
8
16
24
32
40
48
Time (h)
with Shunts
Max Grad
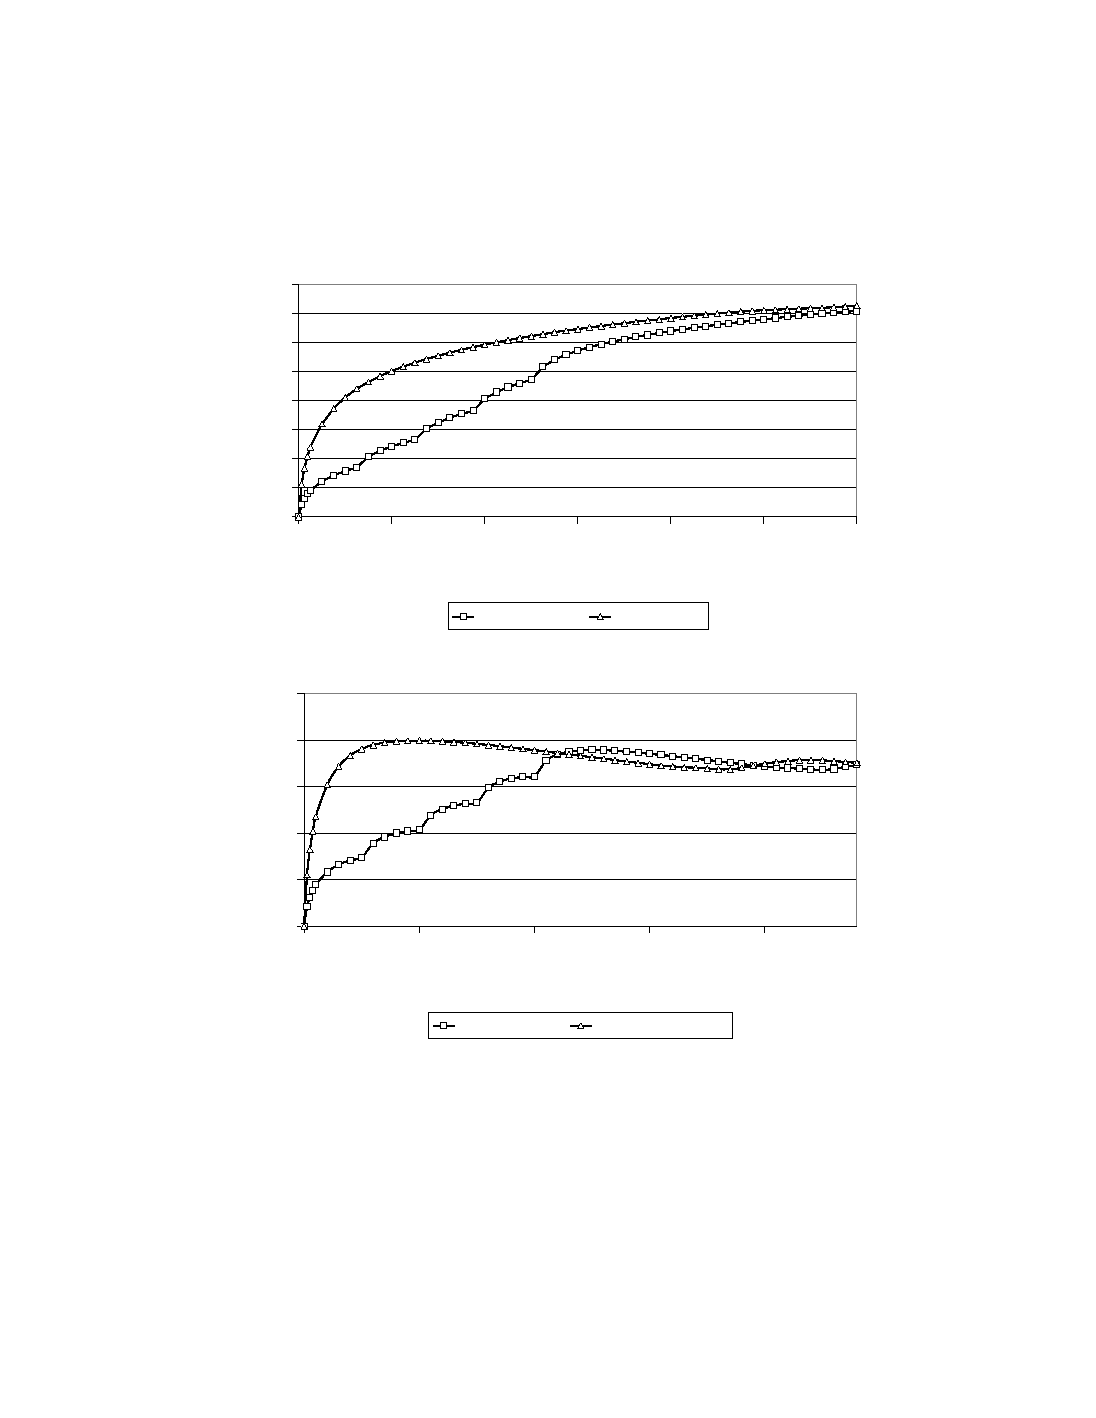
Figure 9 Evolution of Maximum Temperature Difference in Cathode Block.
0
50
100
150
200
250
0
10
20
30
40
Time (h)
with Shunts
Full Line Load
Figure 10 Evolution of Surface and Sub-cathodic Temperature Difference.
The final temperature distribution for both cases is shown in Figure 11 on the deformed lining.
Note that the displacements are exaggerated for clarity. It can be seen that for the case with
shunts, most of the cathode block surface temperature is below typical start-up bath freezing
point while this is the case only at the end of the blocks for the full line load scenario.