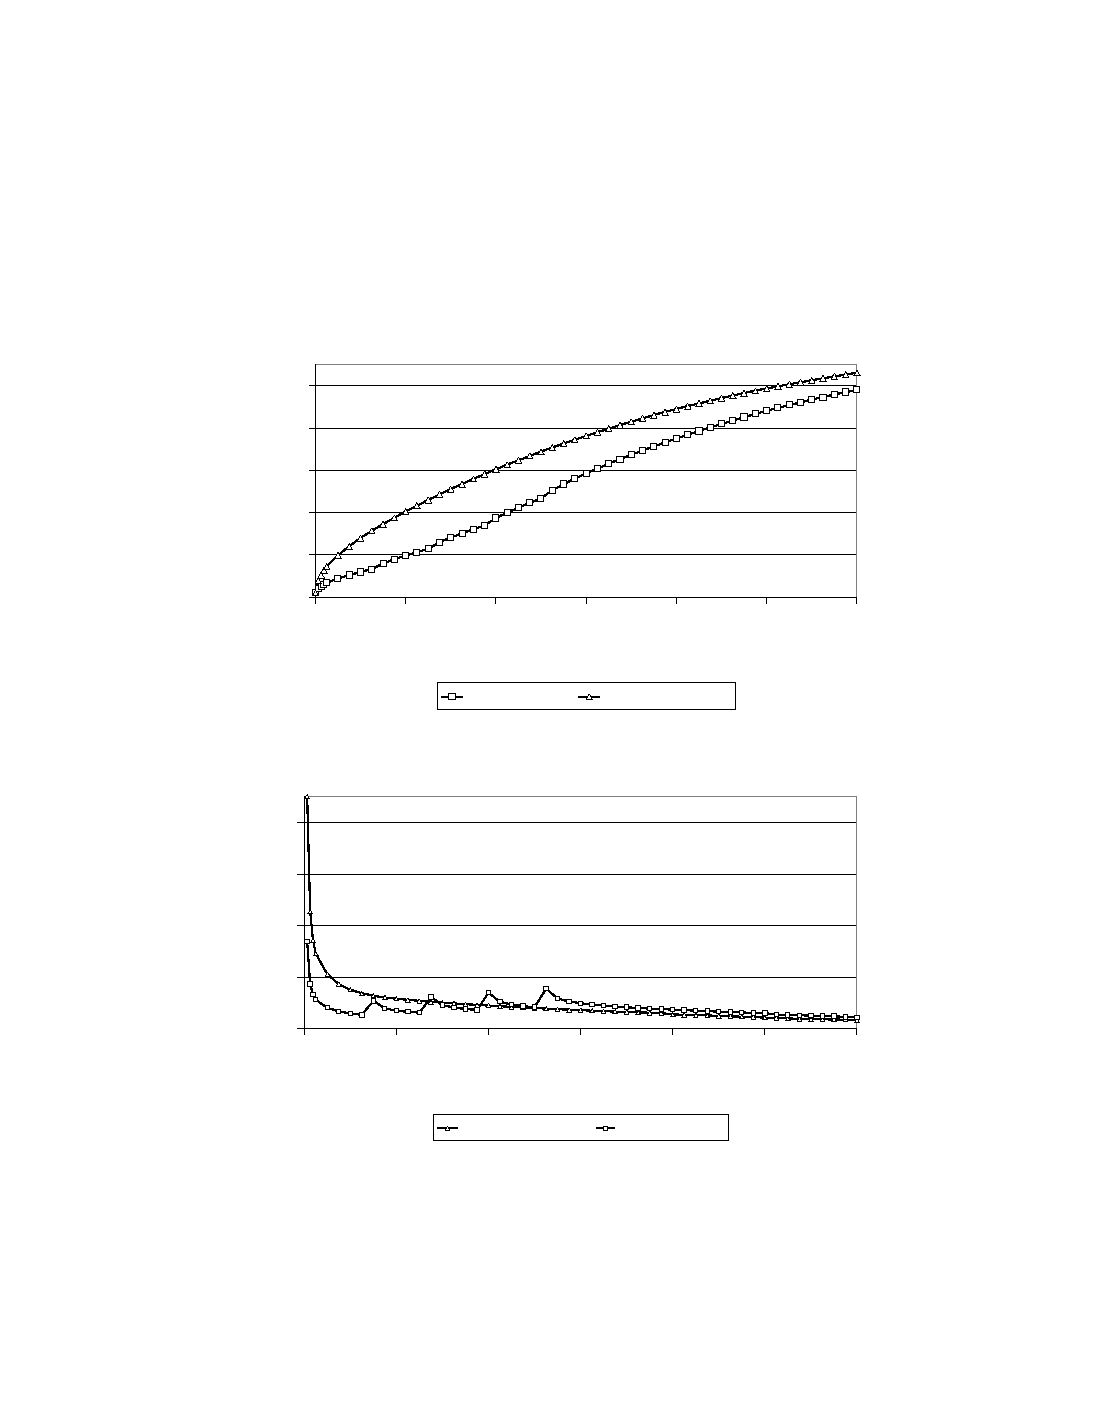
Consequently, the temperature evolution is very different for full line load and with shunts.
Figure 7 compares the maximum cathode surface temperature. It can be seen that the
temperature rises very rapidly for the full line load case, and that the final surface cathode
temperature is also larger in that case. The calculated corresponding heat up rate is compared
in Figure 8. It can be seen that using shunts is an efficient way to control the heat up in the early
stages of preheating, although there is a surge in power every time a shunt is removed.
0
200
400
600
800
1000
0
8
16
24
32
40
48
Time (h)
with Shunts
Full Line Load
Figure 7 Evolution of Maximum Cathode Surface Temperature.
0
50
100
150
200
0
8
16
24
32
40
48
Time (h)
Full Line Load
with Shunts
Figure 8 Calculated Heat up Rate at Maximum Surface Temperature Location.
As expected, the larger initial power input of the full line load case generates significant thermal
gradients through the cathode block, as seen from Figure 9. The vertical gradients through the